| __timestamp | Waste Management, Inc. | XPO Logistics, Inc. |
|---|---|---|
| Wednesday, January 1, 2014 | 4994000000 | 381600000 |
| Thursday, January 1, 2015 | 4730000000 | 1084800000 |
| Friday, January 1, 2016 | 5123000000 | 2139300000 |
| Sunday, January 1, 2017 | 5464000000 | 2279700000 |
| Monday, January 1, 2018 | 5665000000 | 2541000000 |
| Tuesday, January 1, 2019 | 5959000000 | 2666000000 |
| Wednesday, January 1, 2020 | 5877000000 | 2563000000 |
| Friday, January 1, 2021 | 6820000000 | 1994000000 |
| Saturday, January 1, 2022 | 7404000000 | 1227000000 |
| Sunday, January 1, 2023 | 7820000000 | 770000000 |
| Monday, January 1, 2024 | 8680000000 | 915000000 |
Cracking the code
In the ever-evolving landscape of the waste management and logistics industries, understanding financial performance is crucial. Over the past decade, Waste Management, Inc. has consistently outperformed XPO Logistics, Inc. in terms of gross profit. From 2014 to 2023, Waste Management's gross profit surged by approximately 57%, peaking at $7.82 billion in 2023. In contrast, XPO Logistics experienced a more volatile trajectory, with its gross profit peaking in 2019 at $2.67 billion before declining to $770 million in 2023.
This stark contrast highlights Waste Management's robust growth strategy and market dominance, while XPO Logistics faces challenges in maintaining its profit margins. The data underscores the importance of strategic planning and market adaptation in achieving financial success. As the industry continues to evolve, these insights provide a valuable benchmark for stakeholders and investors alike.
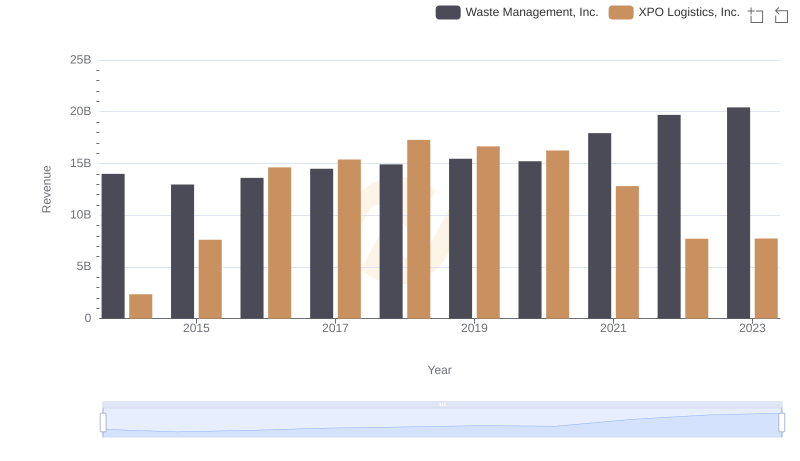
Waste Management, Inc. vs XPO Logistics, Inc.: Annual Revenue Growth Compared
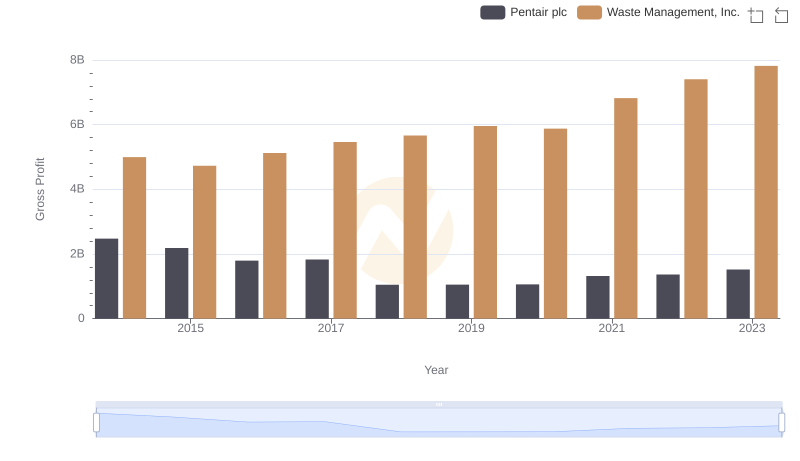
Who Generates Higher Gross Profit? Waste Management, Inc. or Pentair plc
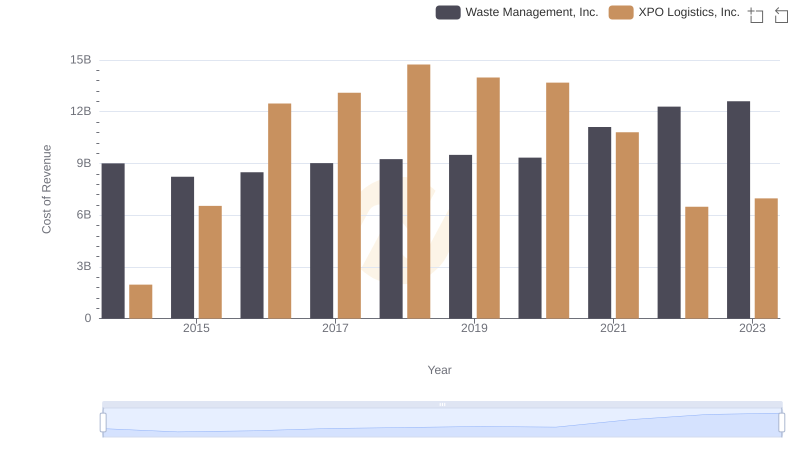
Cost of Revenue: Key Insights for Waste Management, Inc. and XPO Logistics, Inc.
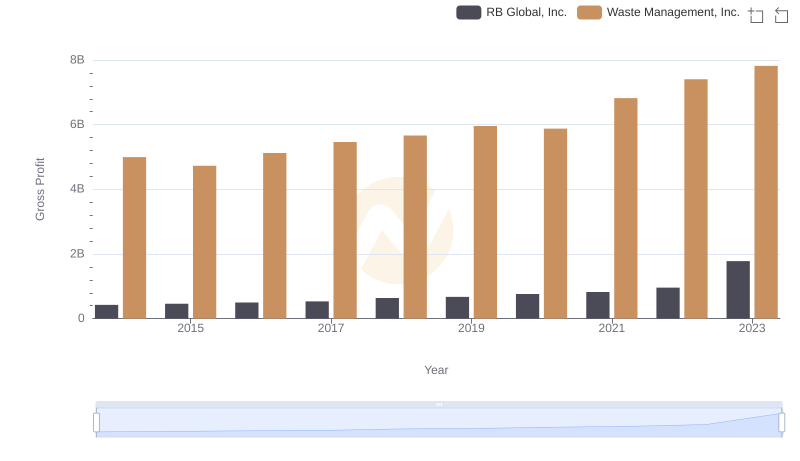
Gross Profit Comparison: Waste Management, Inc. and RB Global, Inc. Trends
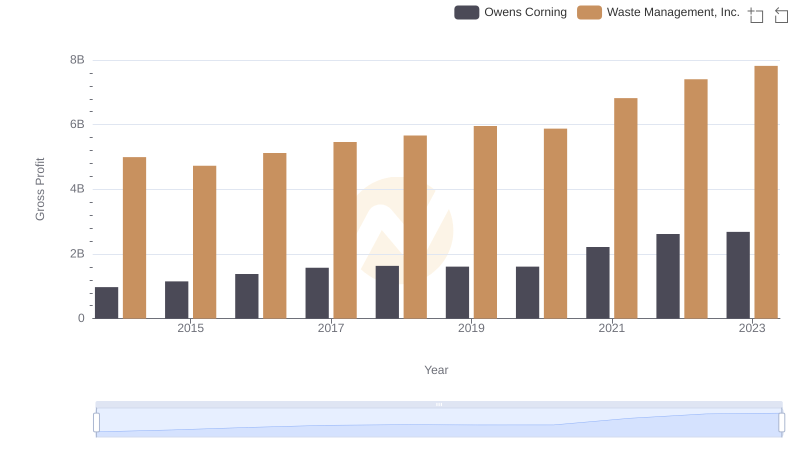
Key Insights on Gross Profit: Waste Management, Inc. vs Owens Corning
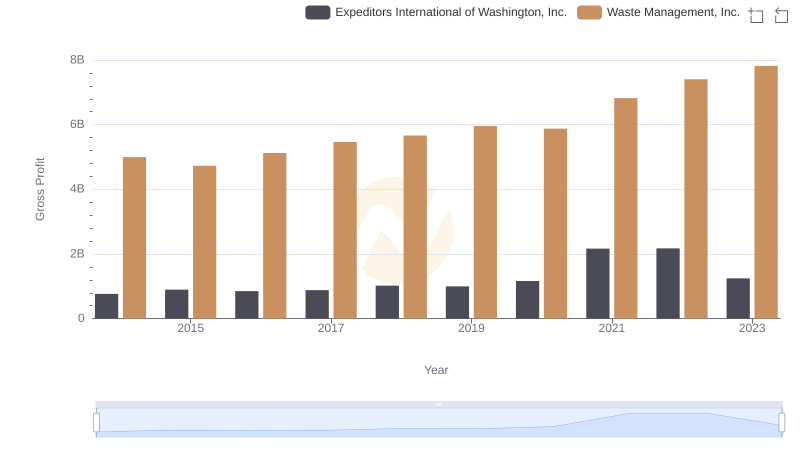
Who Generates Higher Gross Profit? Waste Management, Inc. or Expeditors International of Washington, Inc.
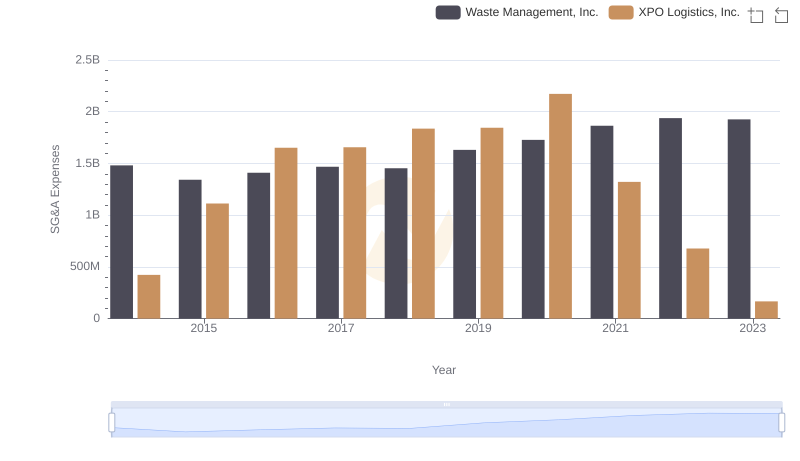
Waste Management, Inc. vs XPO Logistics, Inc.: SG&A Expense Trends
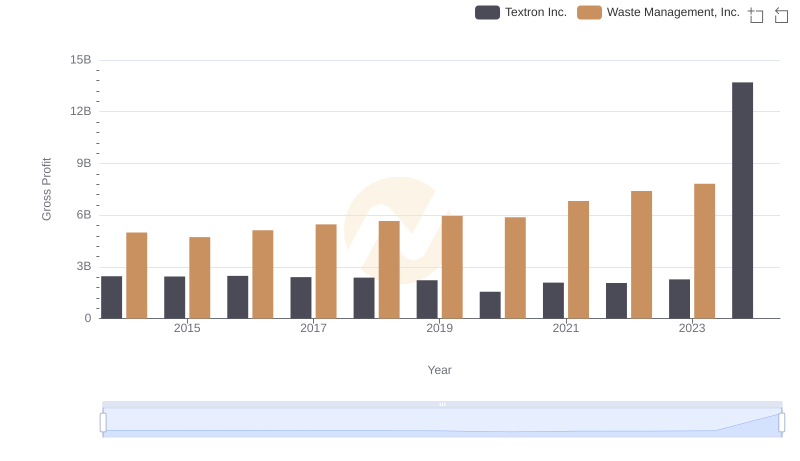
Waste Management, Inc. and Textron Inc.: A Detailed Gross Profit Analysis
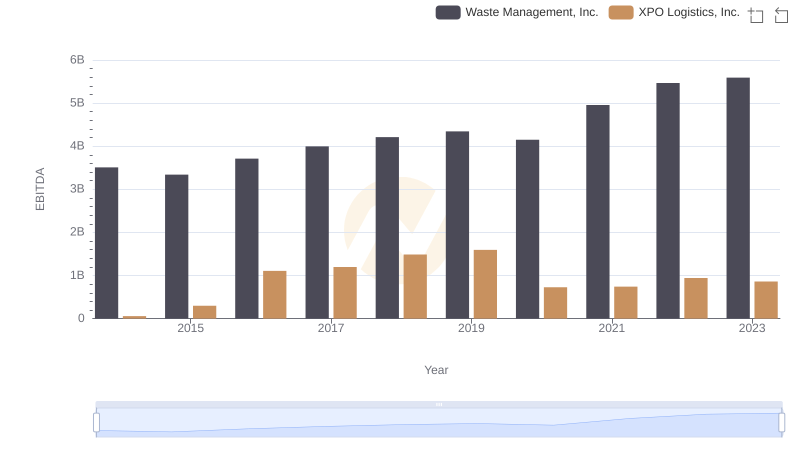
EBITDA Analysis: Evaluating Waste Management, Inc. Against XPO Logistics, Inc.