| __timestamp | Expeditors International of Washington, Inc. | Waste Management, Inc. |
|---|---|---|
| Wednesday, January 1, 2014 | 38125000 | 1481000000 |
| Thursday, January 1, 2015 | 41990000 | 1343000000 |
| Friday, January 1, 2016 | 41763000 | 1410000000 |
| Sunday, January 1, 2017 | 44290000 | 1468000000 |
| Monday, January 1, 2018 | 45346000 | 1453000000 |
| Tuesday, January 1, 2019 | 44002000 | 1631000000 |
| Wednesday, January 1, 2020 | 18436000 | 1728000000 |
| Friday, January 1, 2021 | 16026000 | 1864000000 |
| Saturday, January 1, 2022 | 24293000 | 1938000000 |
| Sunday, January 1, 2023 | 27913000 | 1926000000 |
| Monday, January 1, 2024 | 33331000 | 2264000000 |
Igniting the spark of knowledge
In the world of corporate finance, Selling, General, and Administrative (SG&A) expenses are a critical measure of a company's operational efficiency. This analysis compares the SG&A trends of two industry leaders: Waste Management, Inc. and Expeditors International of Washington, Inc., from 2014 to 2023.
Waste Management, Inc. has shown a consistent upward trend in SG&A expenses, peaking at nearly $1.93 billion in 2022, a 30% increase from 2014. This growth reflects the company's expanding operations and strategic investments in sustainability and technology.
Conversely, Expeditors International experienced fluctuations, with SG&A expenses dropping by over 50% from 2019 to 2021, before rebounding to approximately $27.9 million in 2023. This volatility highlights the challenges faced by logistics companies in adapting to global supply chain disruptions.
This comparison underscores the diverse strategies and challenges faced by companies in different sectors, offering valuable insights for investors and industry analysts.
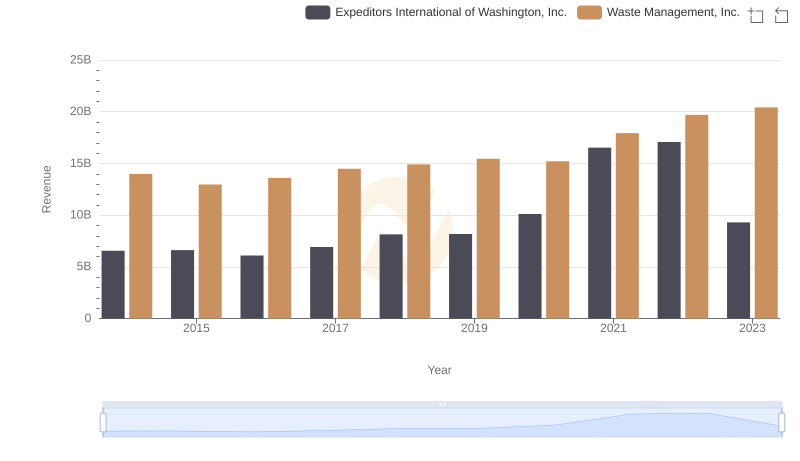
Revenue Insights: Waste Management, Inc. and Expeditors International of Washington, Inc. Performance Compared
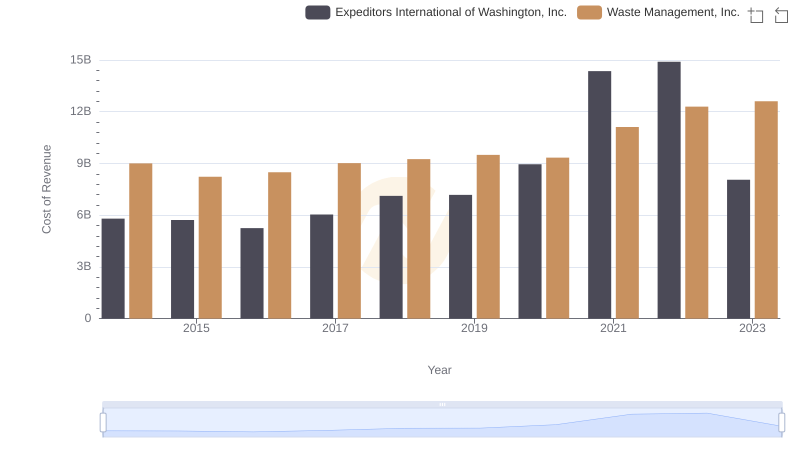
Waste Management, Inc. vs Expeditors International of Washington, Inc.: Efficiency in Cost of Revenue Explored
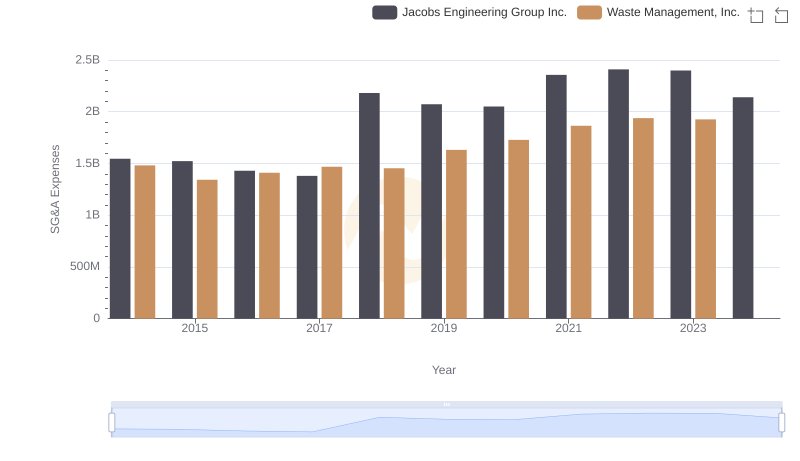
Cost Management Insights: SG&A Expenses for Waste Management, Inc. and Jacobs Engineering Group Inc.
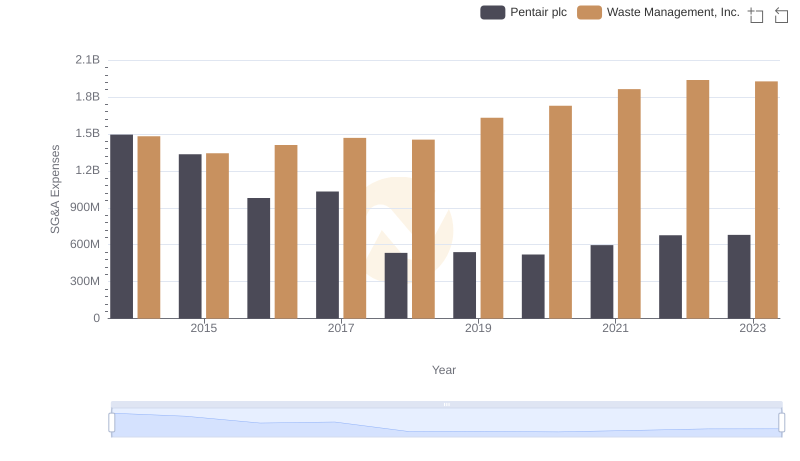
SG&A Efficiency Analysis: Comparing Waste Management, Inc. and Pentair plc
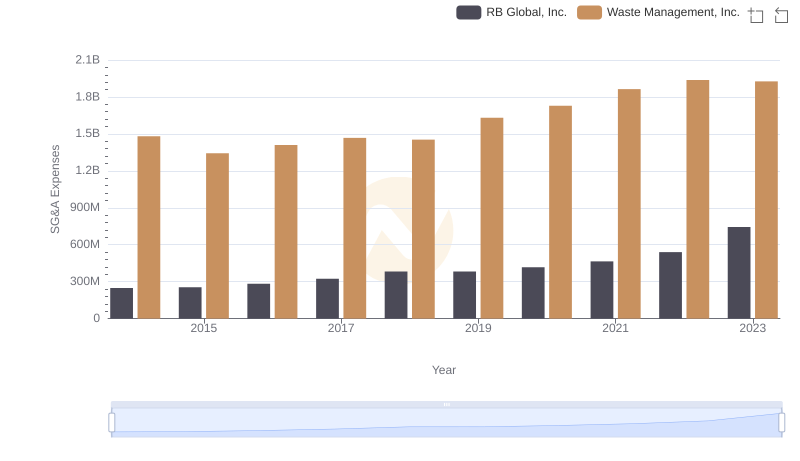
Cost Management Insights: SG&A Expenses for Waste Management, Inc. and RB Global, Inc.
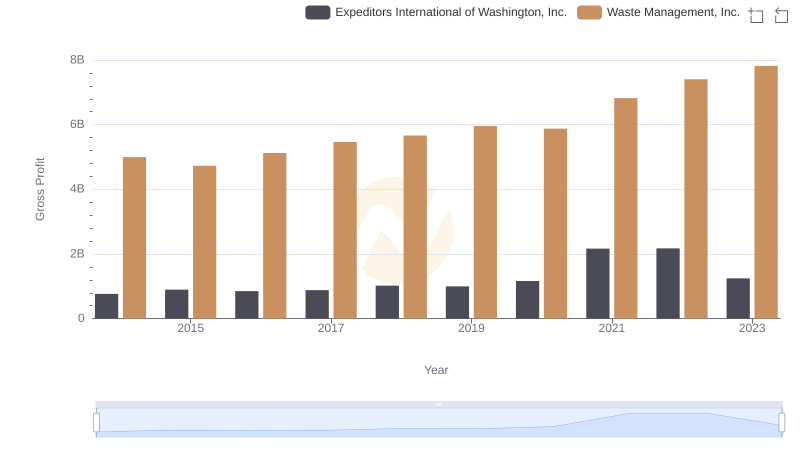
Who Generates Higher Gross Profit? Waste Management, Inc. or Expeditors International of Washington, Inc.
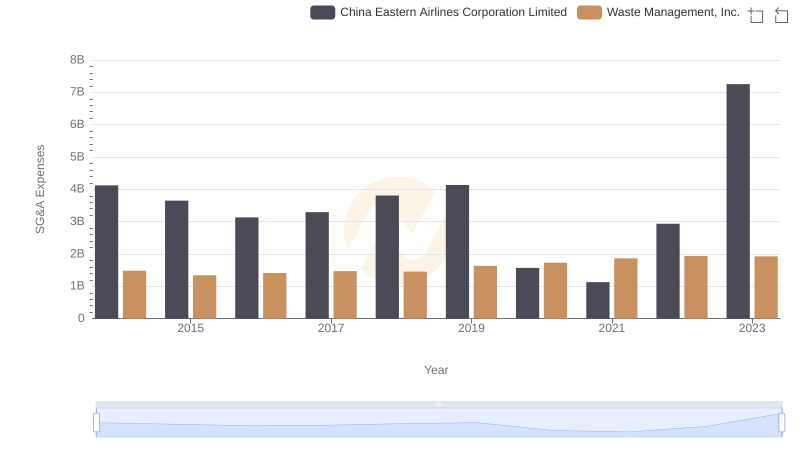
Selling, General, and Administrative Costs: Waste Management, Inc. vs China Eastern Airlines Corporation Limited
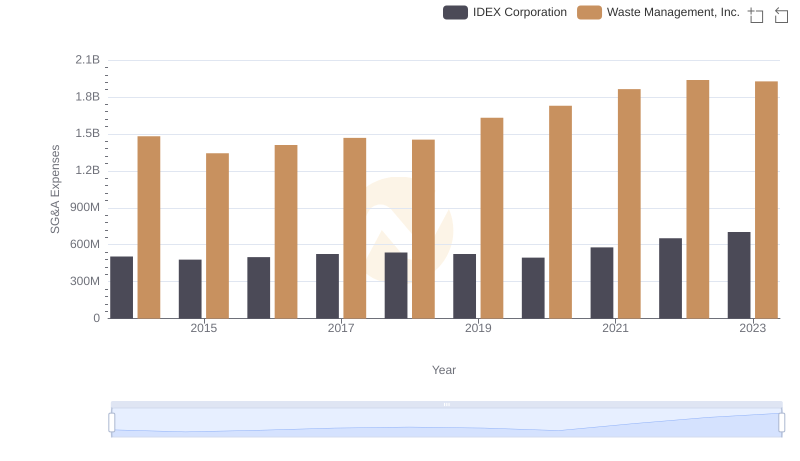
Waste Management, Inc. vs IDEX Corporation: SG&A Expense Trends
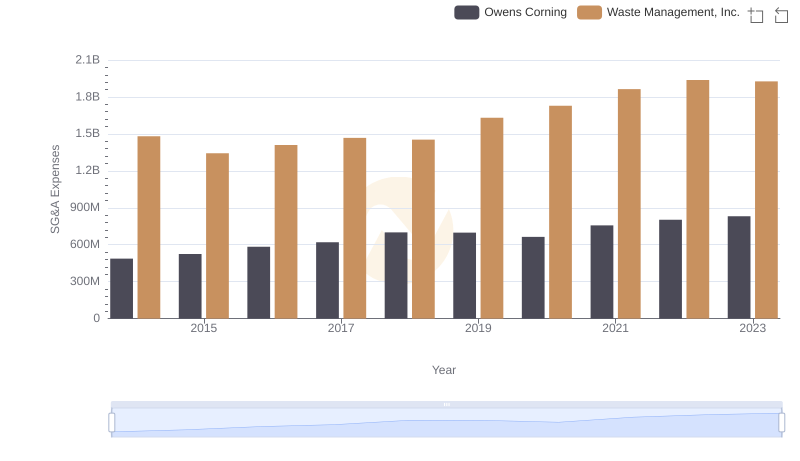
Selling, General, and Administrative Costs: Waste Management, Inc. vs Owens Corning
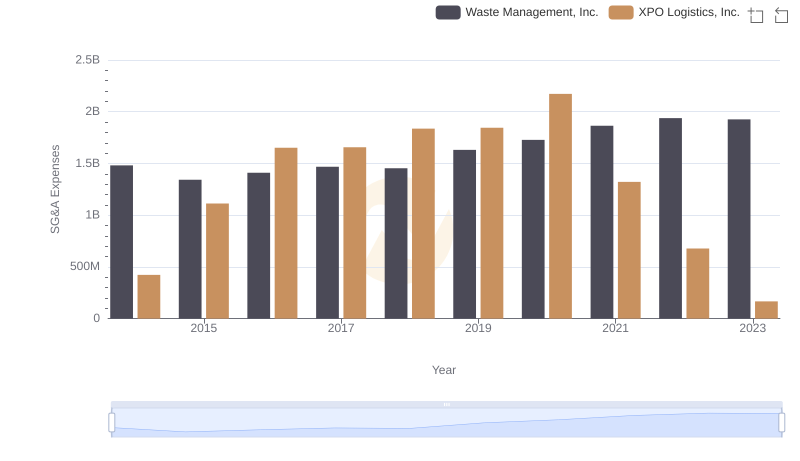
Waste Management, Inc. vs XPO Logistics, Inc.: SG&A Expense Trends
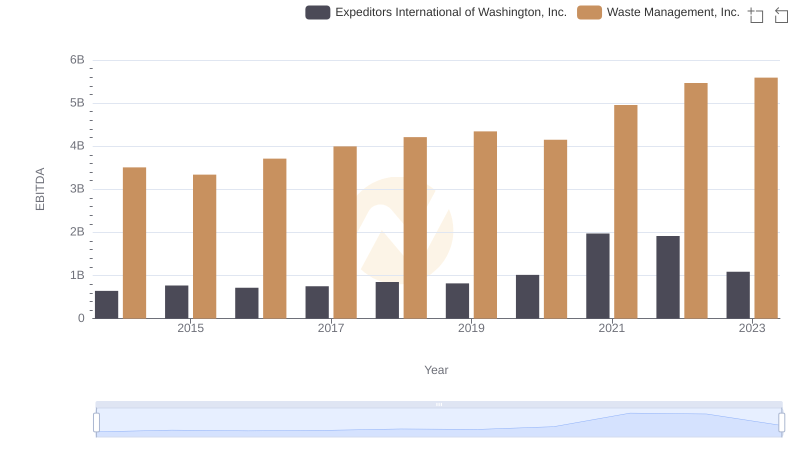
A Professional Review of EBITDA: Waste Management, Inc. Compared to Expeditors International of Washington, Inc.
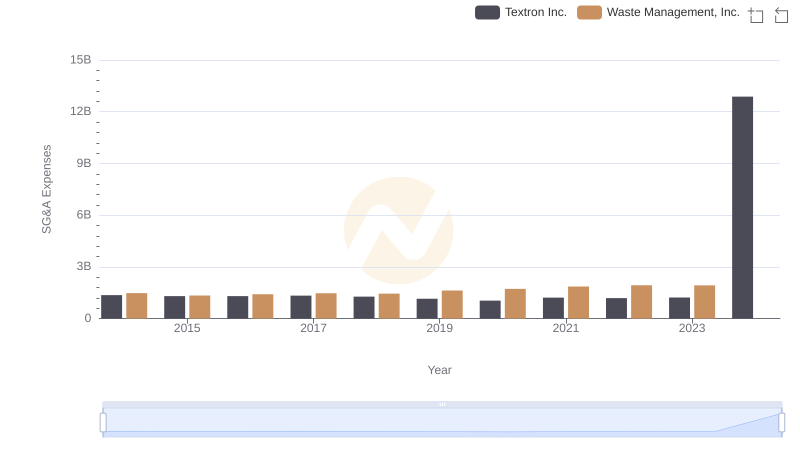
Waste Management, Inc. vs Textron Inc.: SG&A Expense Trends