| __timestamp | Waste Management, Inc. | XPO Logistics, Inc. |
|---|---|---|
| Wednesday, January 1, 2014 | 3509000000 | 56600000 |
| Thursday, January 1, 2015 | 3342000000 | 298000000 |
| Friday, January 1, 2016 | 3713000000 | 1108300000 |
| Sunday, January 1, 2017 | 3996000000 | 1196700000 |
| Monday, January 1, 2018 | 4212000000 | 1488000000 |
| Tuesday, January 1, 2019 | 4344000000 | 1594000000 |
| Wednesday, January 1, 2020 | 4149000000 | 727000000 |
| Friday, January 1, 2021 | 4956000000 | 741000000 |
| Saturday, January 1, 2022 | 5466000000 | 941000000 |
| Sunday, January 1, 2023 | 5592000000 | 860000000 |
| Monday, January 1, 2024 | 5128000000 | 1186000000 |
Unleashing insights
In the ever-evolving landscape of waste management and logistics, two giants have emerged: Waste Management, Inc. and XPO Logistics, Inc. Over the past decade, Waste Management has consistently outperformed XPO Logistics in terms of EBITDA, showcasing a robust growth trajectory. From 2014 to 2023, Waste Management's EBITDA surged by approximately 59%, peaking at $5.6 billion in 2023. In contrast, XPO Logistics experienced a more volatile journey, with its EBITDA fluctuating significantly, reaching a high of $1.6 billion in 2019 before settling at $860 million in 2023.
This analysis highlights the resilience and strategic prowess of Waste Management, which has maintained a steady upward trend despite economic challenges. Meanwhile, XPO Logistics' performance underscores the dynamic nature of the logistics sector, where adaptability is key. As we look to the future, these insights provide a valuable lens through which to view industry trends and investment opportunities.
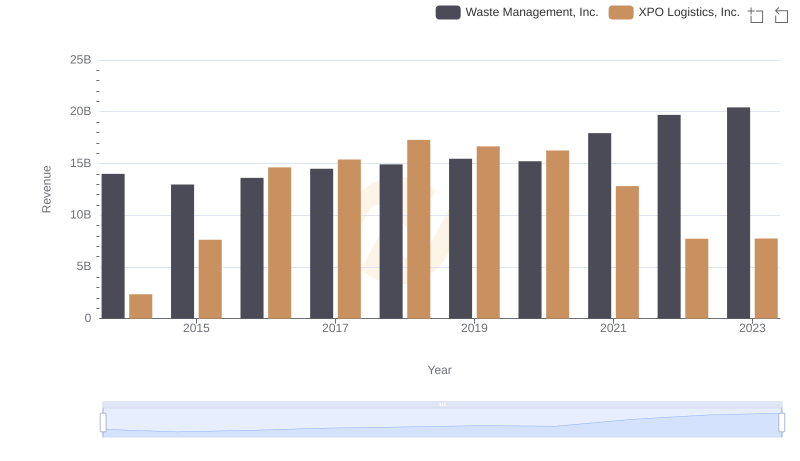
Waste Management, Inc. vs XPO Logistics, Inc.: Annual Revenue Growth Compared
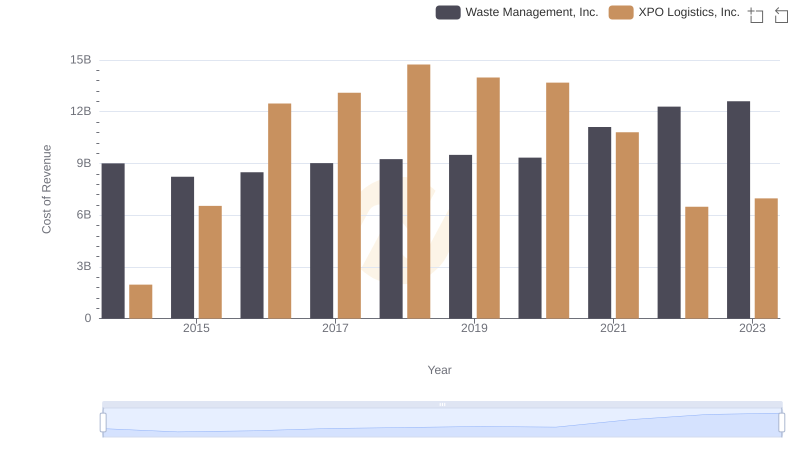
Cost of Revenue: Key Insights for Waste Management, Inc. and XPO Logistics, Inc.
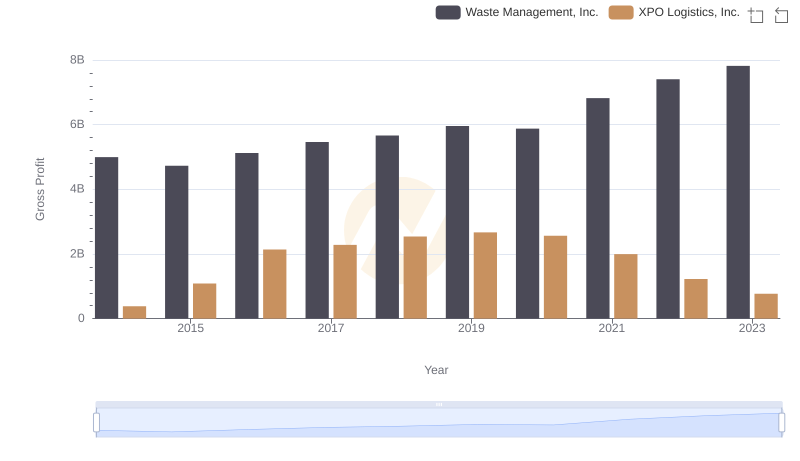
Gross Profit Analysis: Comparing Waste Management, Inc. and XPO Logistics, Inc.
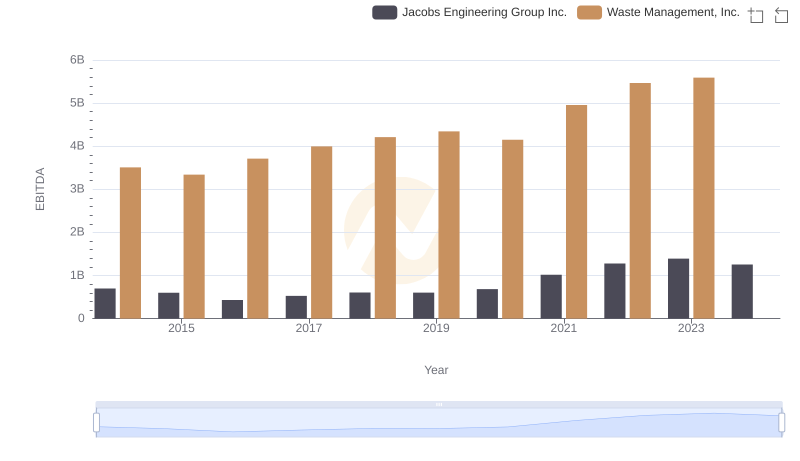
Comparative EBITDA Analysis: Waste Management, Inc. vs Jacobs Engineering Group Inc.
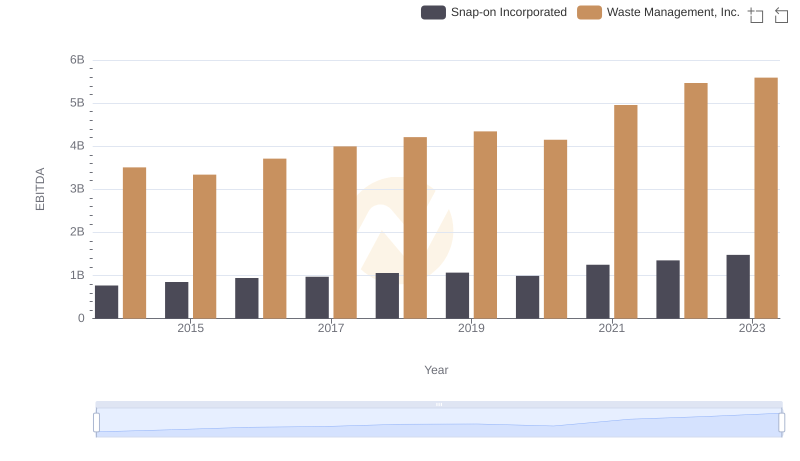
Professional EBITDA Benchmarking: Waste Management, Inc. vs Snap-on Incorporated
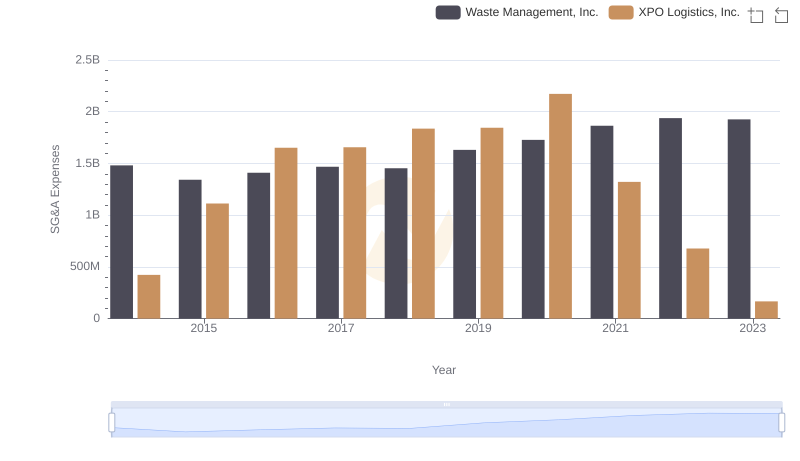
Waste Management, Inc. vs XPO Logistics, Inc.: SG&A Expense Trends
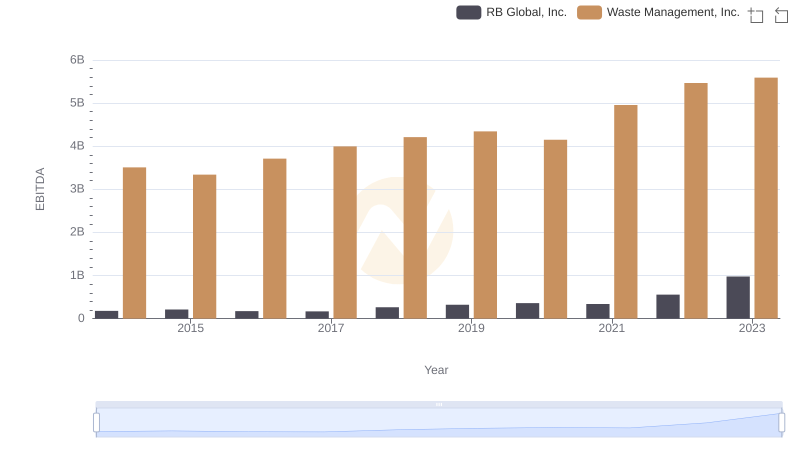
Waste Management, Inc. vs RB Global, Inc.: In-Depth EBITDA Performance Comparison
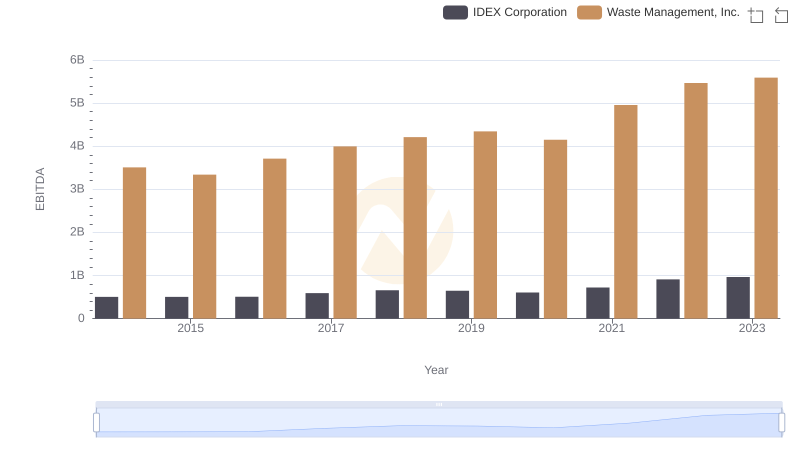
Professional EBITDA Benchmarking: Waste Management, Inc. vs IDEX Corporation
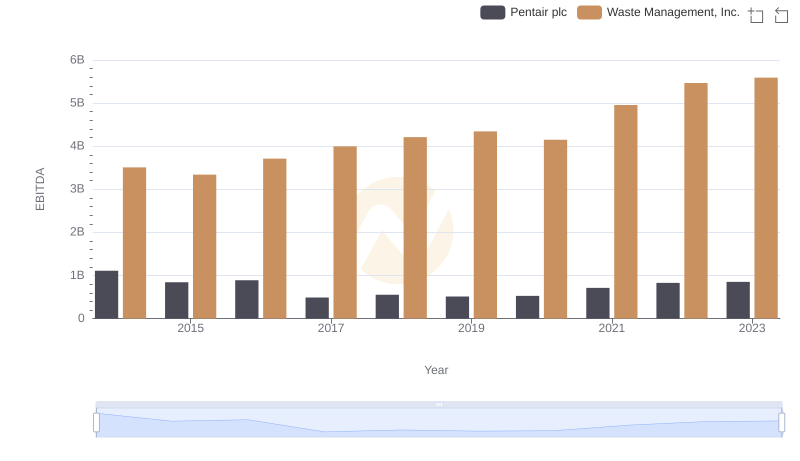
EBITDA Metrics Evaluated: Waste Management, Inc. vs Pentair plc
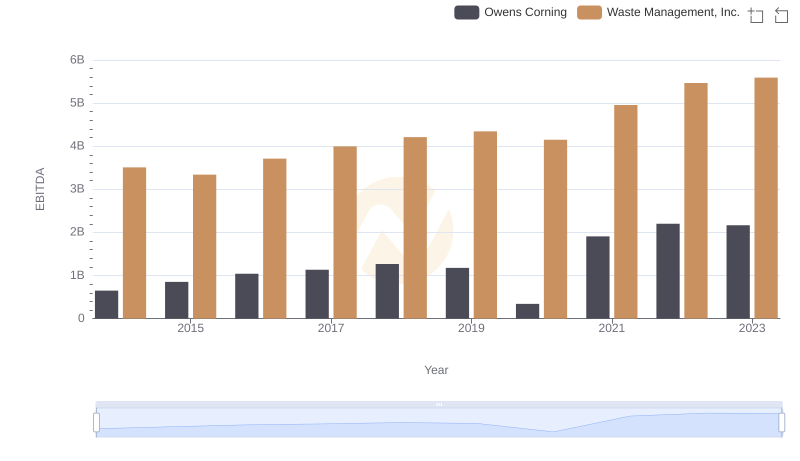
A Side-by-Side Analysis of EBITDA: Waste Management, Inc. and Owens Corning
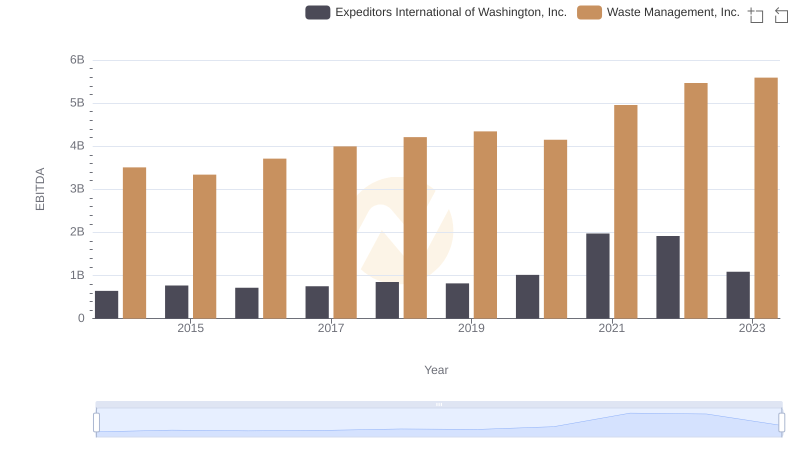
A Professional Review of EBITDA: Waste Management, Inc. Compared to Expeditors International of Washington, Inc.