| __timestamp | Fastenal Company | Waste Management, Inc. |
|---|---|---|
| Wednesday, January 1, 2014 | 1110776000 | 1481000000 |
| Thursday, January 1, 2015 | 1121590000 | 1343000000 |
| Friday, January 1, 2016 | 1169470000 | 1410000000 |
| Sunday, January 1, 2017 | 1282800000 | 1468000000 |
| Monday, January 1, 2018 | 1400200000 | 1453000000 |
| Tuesday, January 1, 2019 | 1459400000 | 1631000000 |
| Wednesday, January 1, 2020 | 1427400000 | 1728000000 |
| Friday, January 1, 2021 | 1559800000 | 1864000000 |
| Saturday, January 1, 2022 | 1762200000 | 1938000000 |
| Sunday, January 1, 2023 | 1825800000 | 1926000000 |
| Monday, January 1, 2024 | 1891900000 | 2264000000 |
Data in motion
In the ever-evolving landscape of corporate finance, understanding the trends in Selling, General, and Administrative (SG&A) expenses is crucial for investors and analysts alike. Over the past decade, from 2014 to 2023, Waste Management, Inc. and Fastenal Company have shown distinct trajectories in their SG&A expenses. Fastenal Company has seen a steady increase, with expenses rising approximately 70% from 2014 to 2023. In contrast, Waste Management, Inc. experienced a more moderate growth of around 30% over the same period. Notably, in 2023, Fastenal's SG&A expenses reached their peak, while Waste Management's data for 2024 remains unavailable, leaving room for speculation. This trend analysis not only highlights the operational strategies of these companies but also provides insights into their financial health and market positioning. As we look to the future, these trends will be pivotal in shaping investor decisions and corporate strategies.

Waste Management, Inc. vs Fastenal Company: Examining Key Revenue Metrics
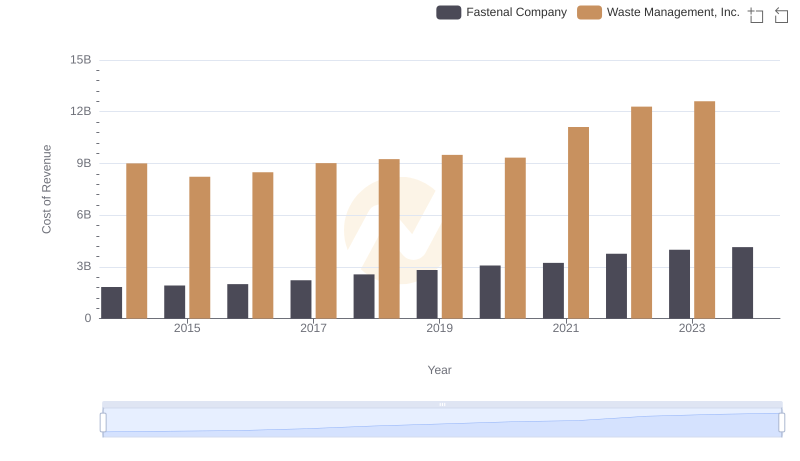
Comparing Cost of Revenue Efficiency: Waste Management, Inc. vs Fastenal Company
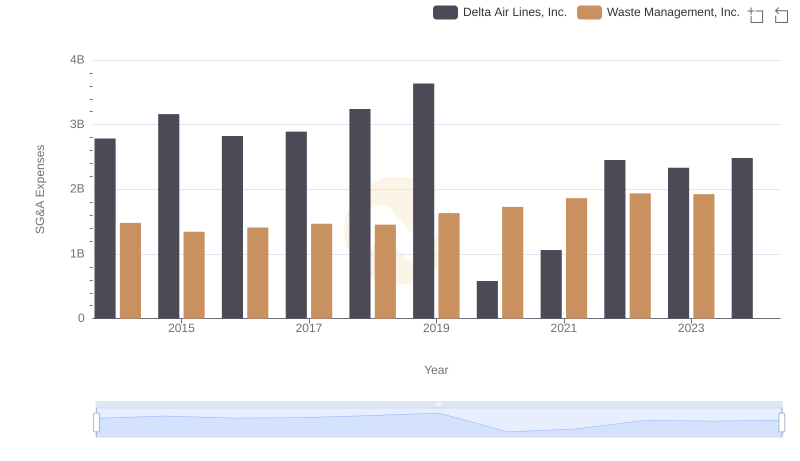
Waste Management, Inc. or Delta Air Lines, Inc.: Who Manages SG&A Costs Better?
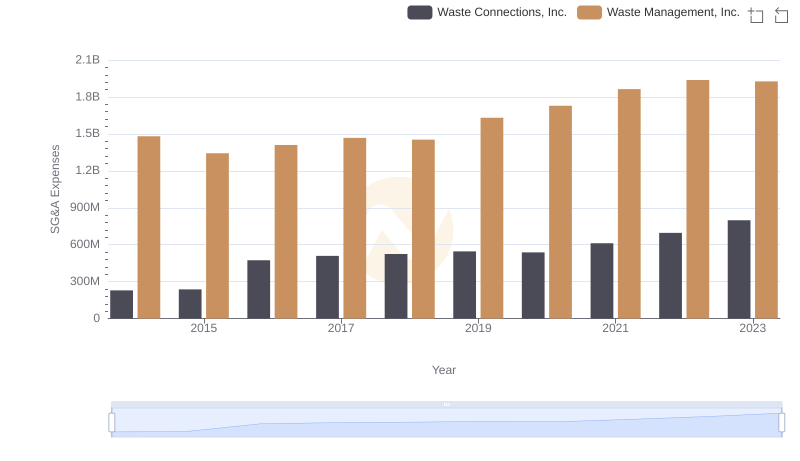
SG&A Efficiency Analysis: Comparing Waste Management, Inc. and Waste Connections, Inc.
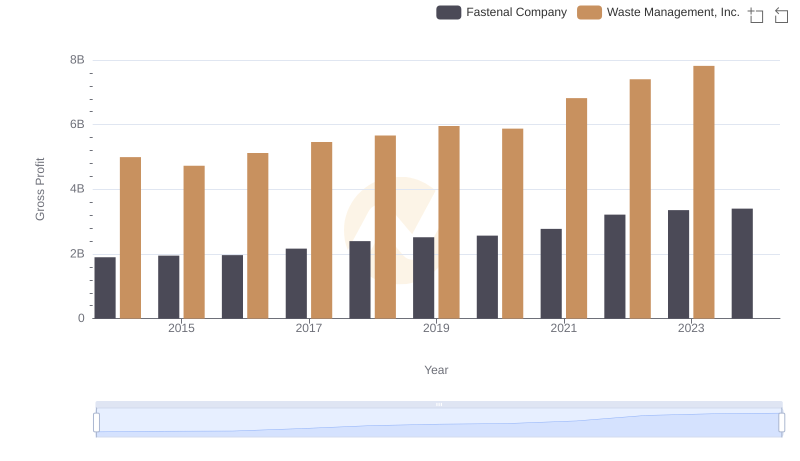
Gross Profit Trends Compared: Waste Management, Inc. vs Fastenal Company
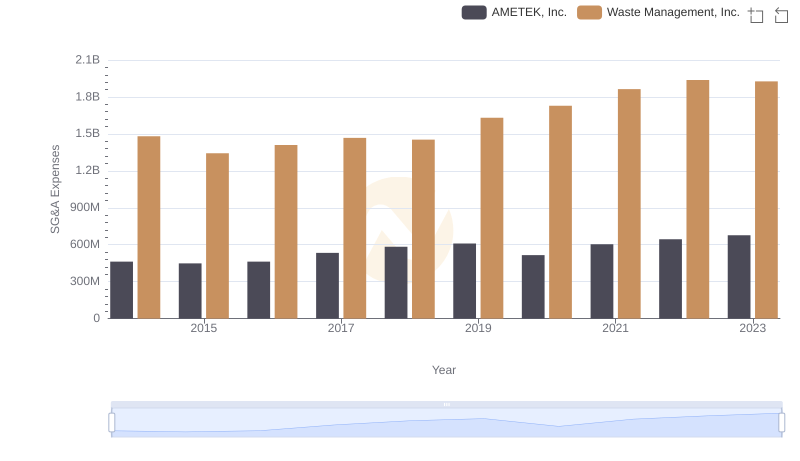
SG&A Efficiency Analysis: Comparing Waste Management, Inc. and AMETEK, Inc.
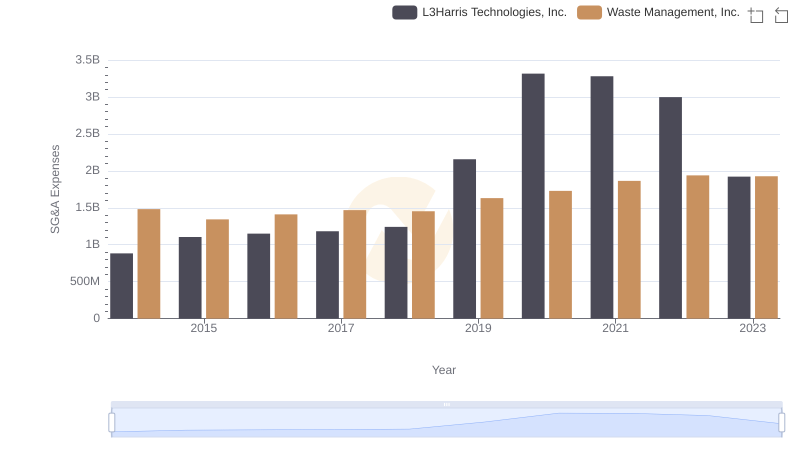
Selling, General, and Administrative Costs: Waste Management, Inc. vs L3Harris Technologies, Inc.
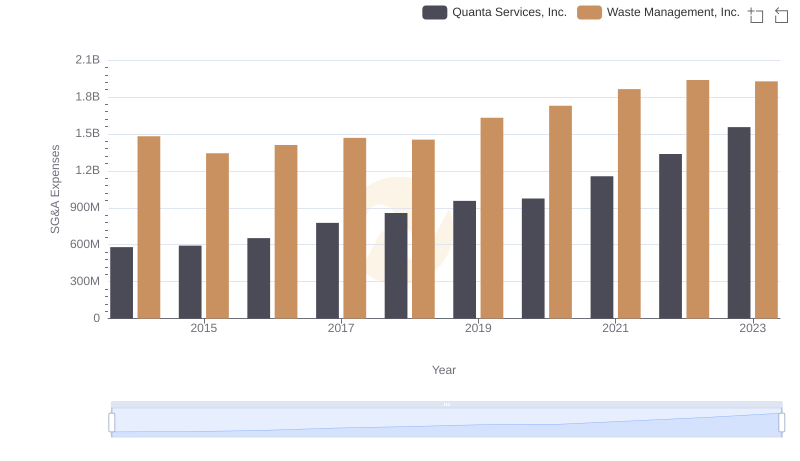
Operational Costs Compared: SG&A Analysis of Waste Management, Inc. and Quanta Services, Inc.
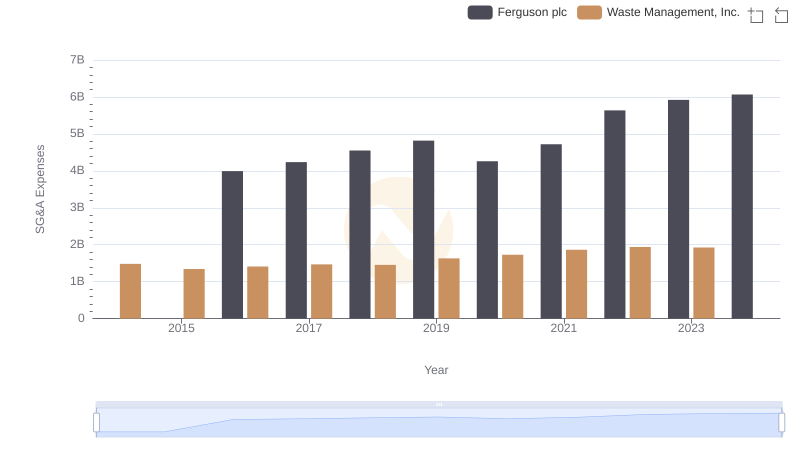
Breaking Down SG&A Expenses: Waste Management, Inc. vs Ferguson plc

SG&A Efficiency Analysis: Comparing Waste Management, Inc. and Old Dominion Freight Line, Inc.
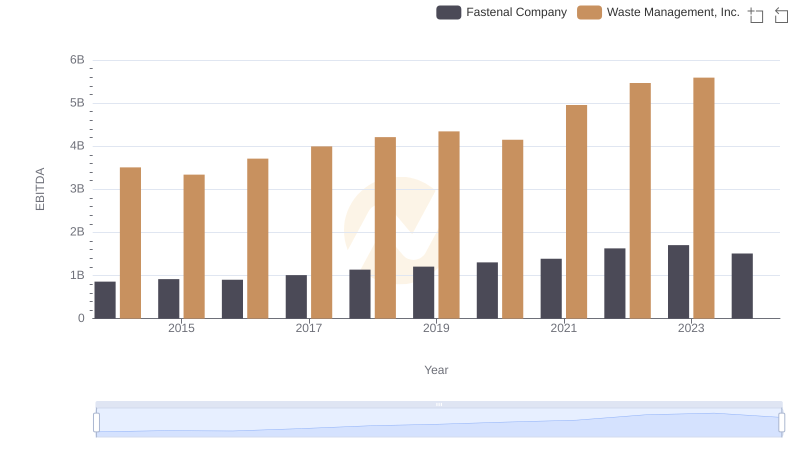
EBITDA Analysis: Evaluating Waste Management, Inc. Against Fastenal Company
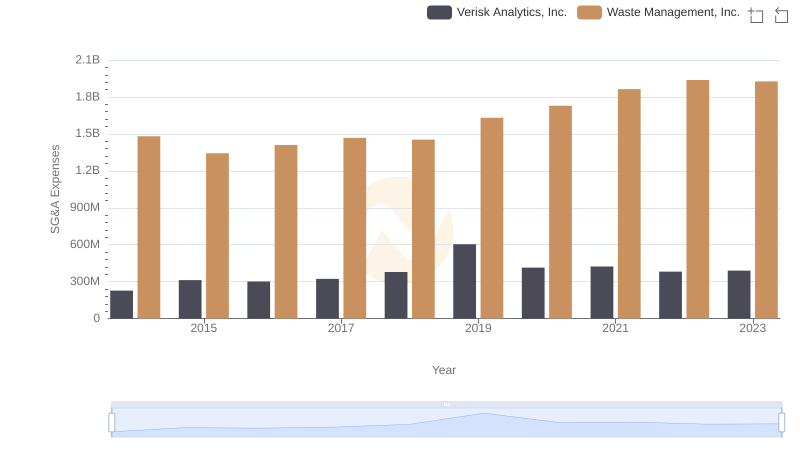
Breaking Down SG&A Expenses: Waste Management, Inc. vs Verisk Analytics, Inc.