| __timestamp | Fastenal Company | Waste Management, Inc. |
|---|---|---|
| Wednesday, January 1, 2014 | 3733507000 | 13996000000 |
| Thursday, January 1, 2015 | 3869187000 | 12961000000 |
| Friday, January 1, 2016 | 3962036000 | 13609000000 |
| Sunday, January 1, 2017 | 4390500000 | 14485000000 |
| Monday, January 1, 2018 | 4965100000 | 14914000000 |
| Tuesday, January 1, 2019 | 5333700000 | 15455000000 |
| Wednesday, January 1, 2020 | 5647300000 | 15218000000 |
| Friday, January 1, 2021 | 6010900000 | 17931000000 |
| Saturday, January 1, 2022 | 6980600000 | 19698000000 |
| Sunday, January 1, 2023 | 7346700000 | 20426000000 |
| Monday, January 1, 2024 | 7546000000 | 22063000000 |
Cracking the code
In the ever-evolving landscape of American business, Waste Management, Inc. and Fastenal Company have emerged as stalwarts in their respective industries. Over the past decade, Waste Management has consistently outpaced Fastenal in revenue, showcasing a robust growth trajectory. From 2014 to 2023, Waste Management's revenue surged by approximately 46%, peaking at over $20 billion in 2023. This growth underscores the increasing demand for sustainable waste solutions in a world grappling with environmental challenges.
Conversely, Fastenal Company, a leader in industrial supplies, demonstrated a steady revenue increase of around 102% over the same period, reaching nearly $7.5 billion in 2023. This growth reflects the expanding industrial sector and the company's strategic market positioning. Notably, 2024 data for Waste Management is missing, leaving room for speculation on its future trajectory. As these giants continue to evolve, their financial narratives offer valuable insights into broader economic trends.
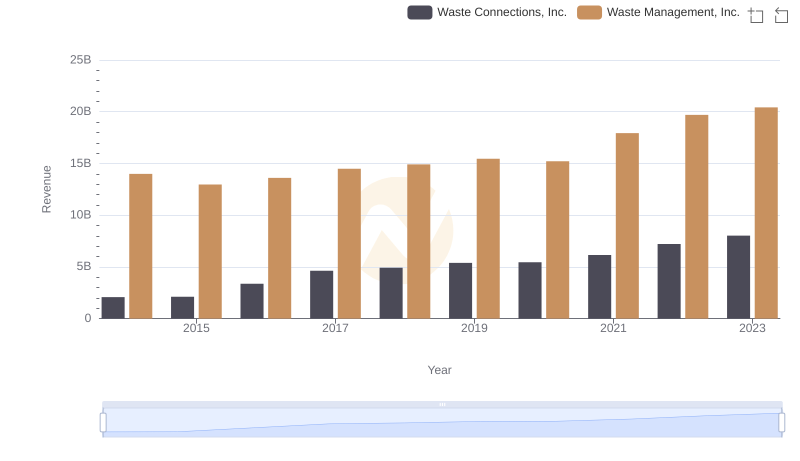
Who Generates More Revenue? Waste Management, Inc. or Waste Connections, Inc.
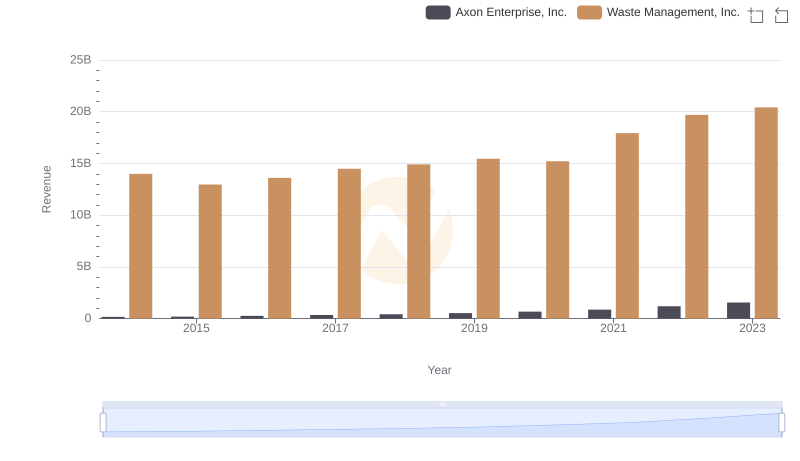
Waste Management, Inc. or Axon Enterprise, Inc.: Who Leads in Yearly Revenue?

Breaking Down Revenue Trends: Waste Management, Inc. vs Delta Air Lines, Inc.
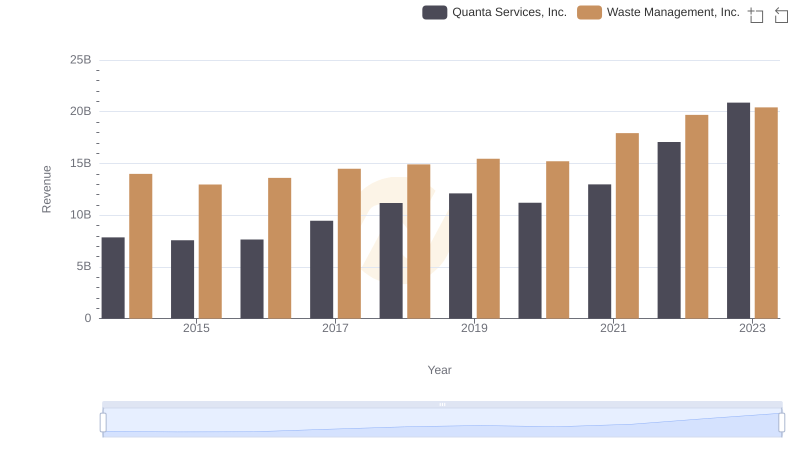
Waste Management, Inc. and Quanta Services, Inc.: A Comprehensive Revenue Analysis
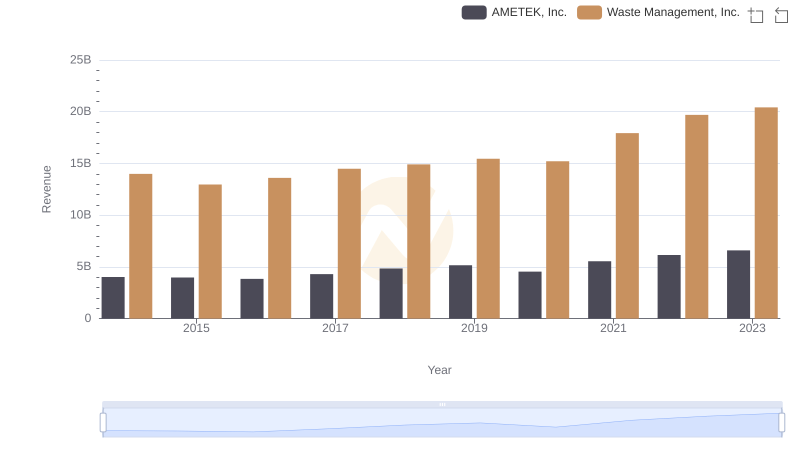
Waste Management, Inc. and AMETEK, Inc.: A Comprehensive Revenue Analysis
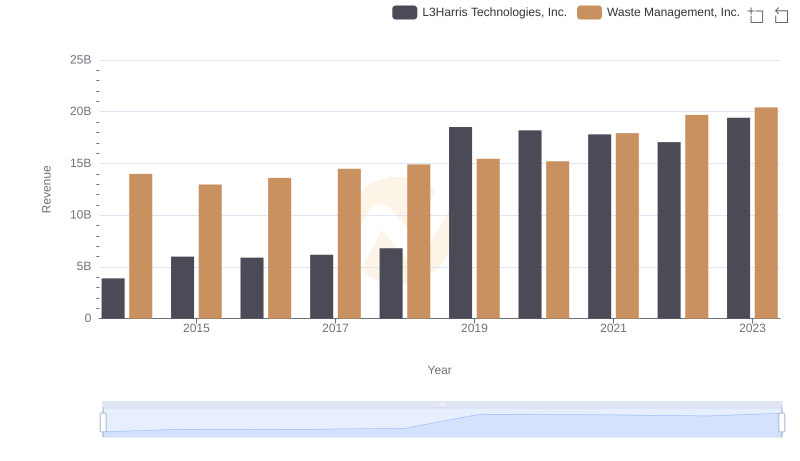
Waste Management, Inc. vs L3Harris Technologies, Inc.: Annual Revenue Growth Compared

Revenue Showdown: Waste Management, Inc. vs Old Dominion Freight Line, Inc.
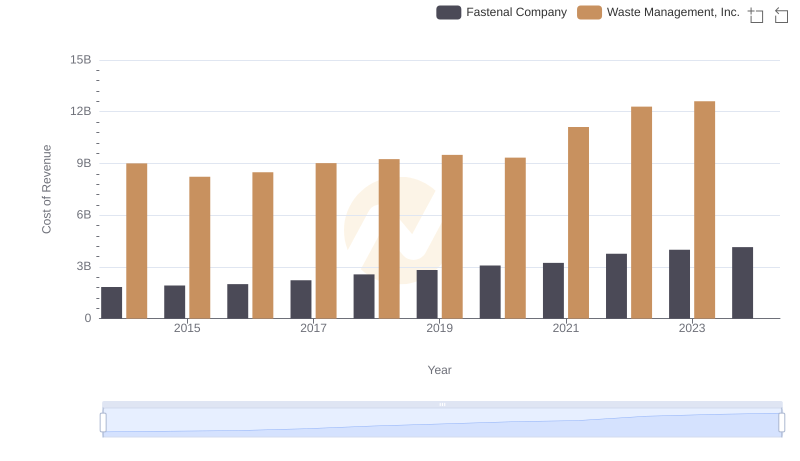
Comparing Cost of Revenue Efficiency: Waste Management, Inc. vs Fastenal Company
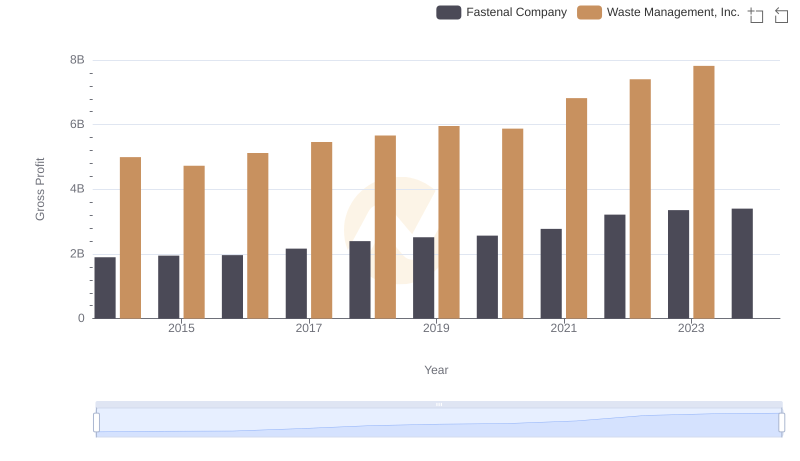
Gross Profit Trends Compared: Waste Management, Inc. vs Fastenal Company
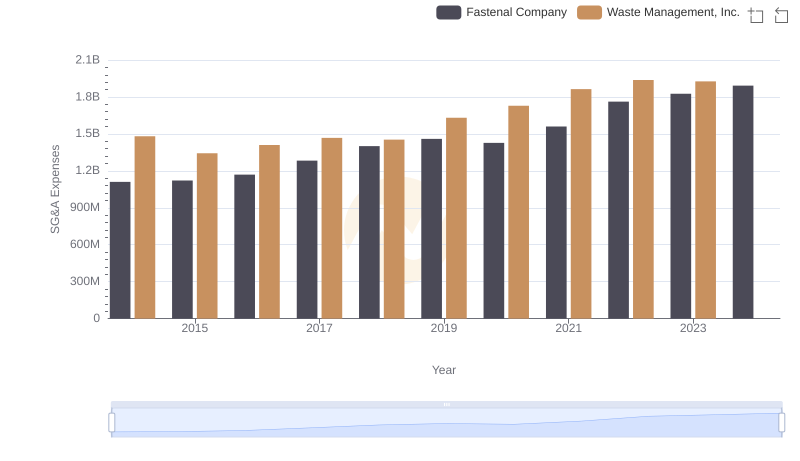
Waste Management, Inc. vs Fastenal Company: SG&A Expense Trends
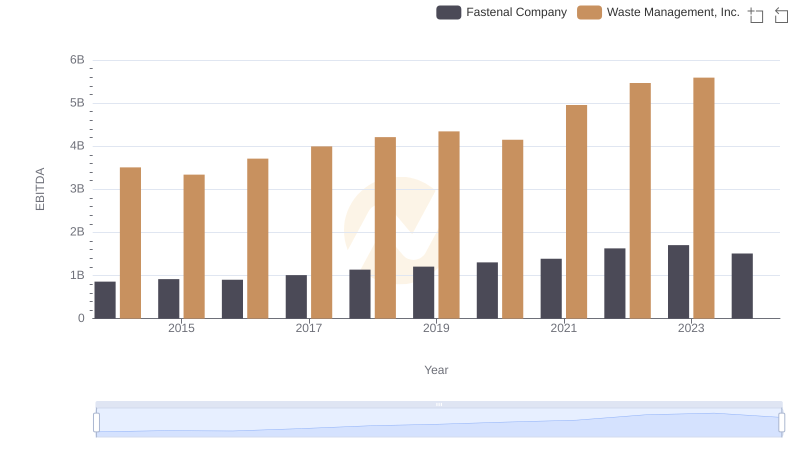
EBITDA Analysis: Evaluating Waste Management, Inc. Against Fastenal Company