| __timestamp | Fastenal Company | Waste Management, Inc. |
|---|---|---|
| Wednesday, January 1, 2014 | 859298000 | 3509000000 |
| Thursday, January 1, 2015 | 915726000 | 3342000000 |
| Friday, January 1, 2016 | 900285000 | 3713000000 |
| Sunday, January 1, 2017 | 1008200000 | 3996000000 |
| Monday, January 1, 2018 | 1136900000 | 4212000000 |
| Tuesday, January 1, 2019 | 1205900000 | 4344000000 |
| Wednesday, January 1, 2020 | 1304200000 | 4149000000 |
| Friday, January 1, 2021 | 1388200000 | 4956000000 |
| Saturday, January 1, 2022 | 1630900000 | 5466000000 |
| Sunday, January 1, 2023 | 1706000000 | 5592000000 |
| Monday, January 1, 2024 | 1510000000 | 5128000000 |
Cracking the code
In the ever-evolving landscape of American industry, Waste Management, Inc. and Fastenal Company stand as titans in their respective fields. Over the past decade, Waste Management has consistently outperformed Fastenal in terms of EBITDA, showcasing a robust growth trajectory. From 2014 to 2023, Waste Management's EBITDA surged by approximately 60%, peaking at 5.6 billion in 2023. In contrast, Fastenal's EBITDA grew by nearly 100% during the same period, reaching 1.7 billion in 2023.
Waste Management's dominance is evident, with its EBITDA consistently surpassing Fastenal's by a factor of three to four times. However, Fastenal's impressive growth rate highlights its potential in the industrial sector. The data for 2024 remains incomplete, leaving room for speculation on future trends. As these companies continue to innovate, their financial trajectories will be crucial for investors and industry analysts alike.

Waste Management, Inc. vs Fastenal Company: Examining Key Revenue Metrics
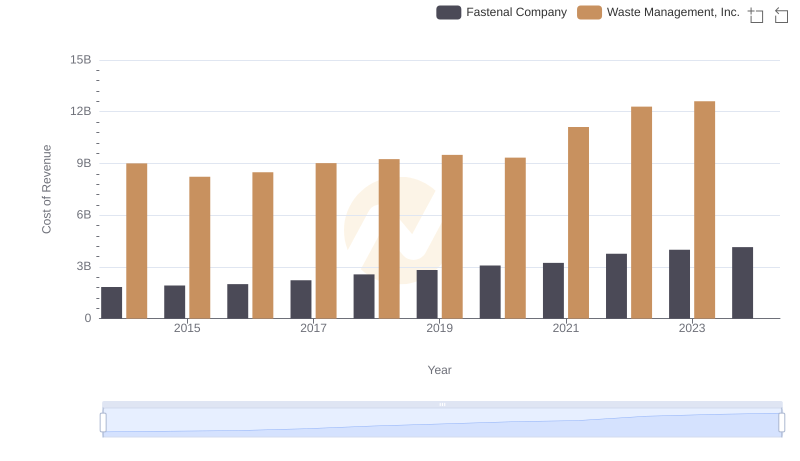
Comparing Cost of Revenue Efficiency: Waste Management, Inc. vs Fastenal Company
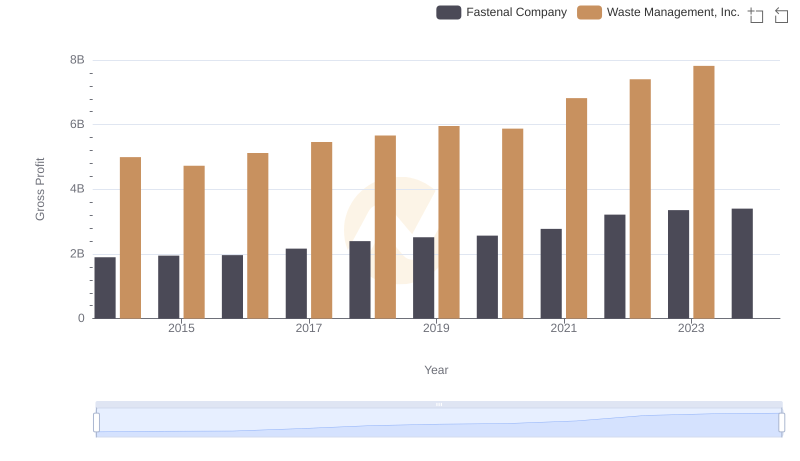
Gross Profit Trends Compared: Waste Management, Inc. vs Fastenal Company
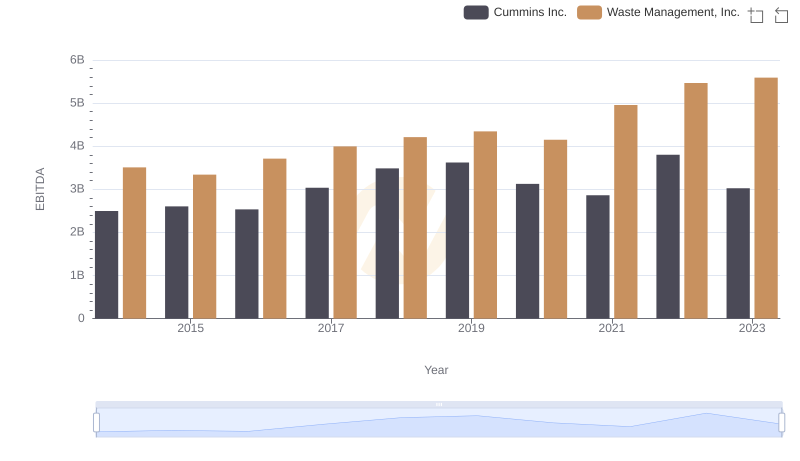
EBITDA Metrics Evaluated: Waste Management, Inc. vs Cummins Inc.
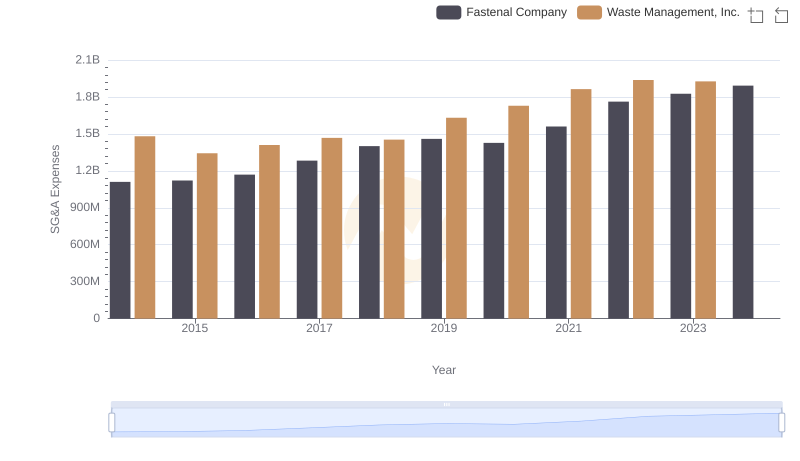
Waste Management, Inc. vs Fastenal Company: SG&A Expense Trends
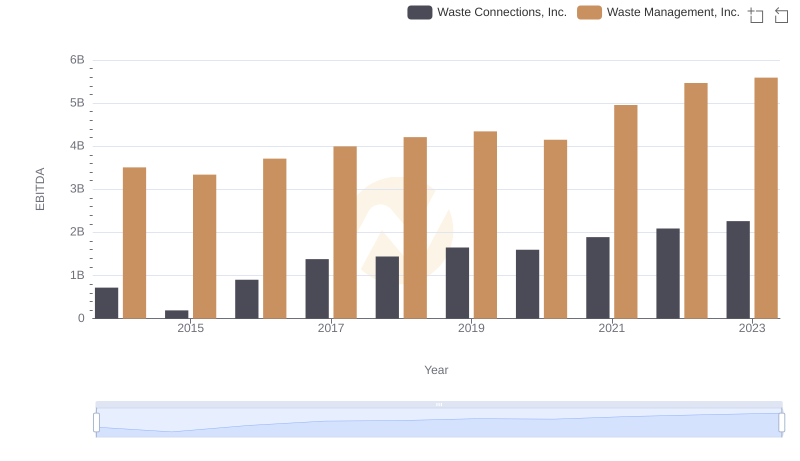
A Side-by-Side Analysis of EBITDA: Waste Management, Inc. and Waste Connections, Inc.
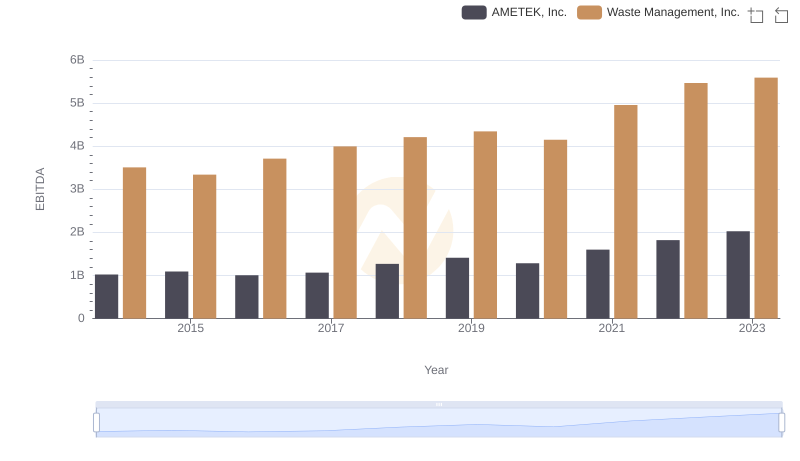
Comprehensive EBITDA Comparison: Waste Management, Inc. vs AMETEK, Inc.
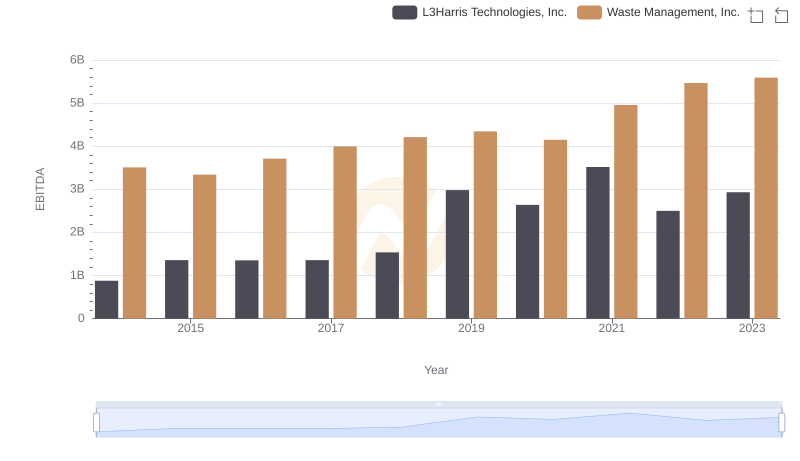
Waste Management, Inc. and L3Harris Technologies, Inc.: A Detailed Examination of EBITDA Performance
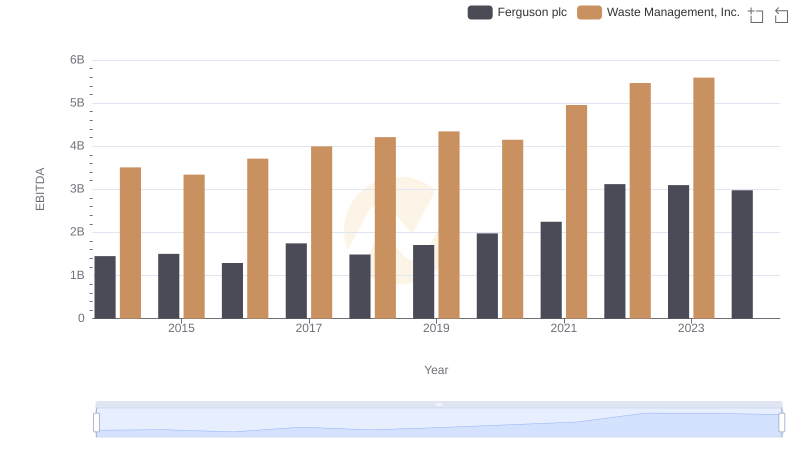
Waste Management, Inc. and Ferguson plc: A Detailed Examination of EBITDA Performance
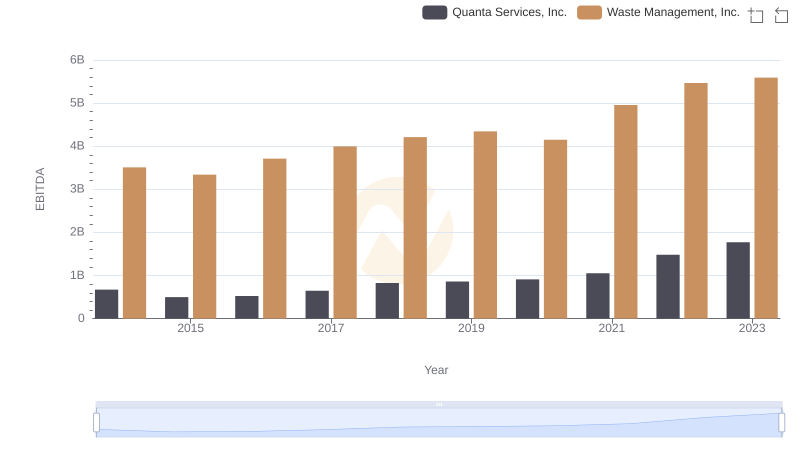
Professional EBITDA Benchmarking: Waste Management, Inc. vs Quanta Services, Inc.
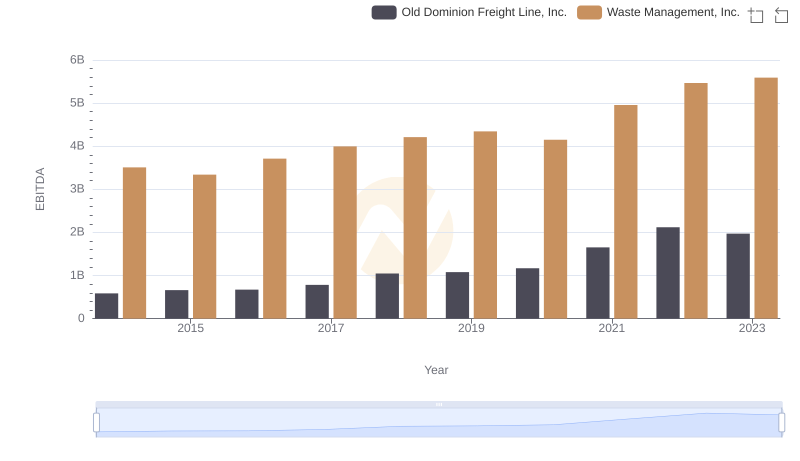
A Professional Review of EBITDA: Waste Management, Inc. Compared to Old Dominion Freight Line, Inc.
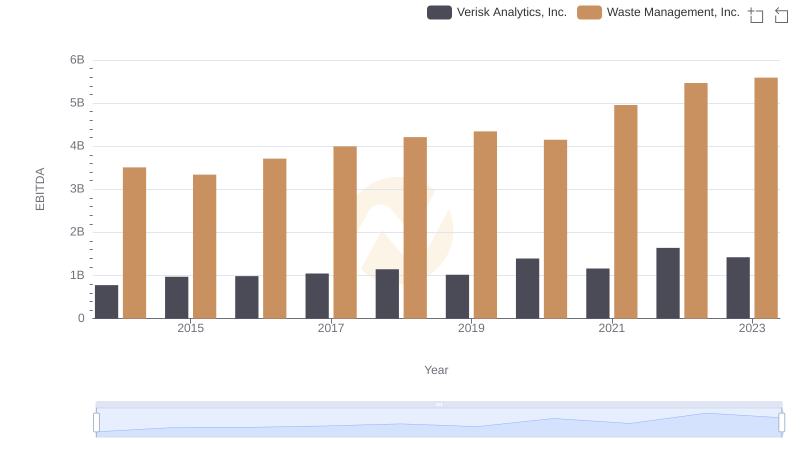
A Professional Review of EBITDA: Waste Management, Inc. Compared to Verisk Analytics, Inc.