| __timestamp | Quanta Services, Inc. | Waste Management, Inc. |
|---|---|---|
| Wednesday, January 1, 2014 | 580730000 | 1481000000 |
| Thursday, January 1, 2015 | 592863000 | 1343000000 |
| Friday, January 1, 2016 | 653338000 | 1410000000 |
| Sunday, January 1, 2017 | 777920000 | 1468000000 |
| Monday, January 1, 2018 | 857574000 | 1453000000 |
| Tuesday, January 1, 2019 | 955991000 | 1631000000 |
| Wednesday, January 1, 2020 | 975074000 | 1728000000 |
| Friday, January 1, 2021 | 1155956000 | 1864000000 |
| Saturday, January 1, 2022 | 1336711000 | 1938000000 |
| Sunday, January 1, 2023 | 1555137000 | 1926000000 |
| Monday, January 1, 2024 | 2264000000 |
Unveiling the hidden dimensions of data
In the ever-evolving landscape of corporate America, operational efficiency remains a cornerstone of success. Over the past decade, Waste Management, Inc. and Quanta Services, Inc. have demonstrated contrasting trajectories in their Selling, General, and Administrative (SG&A) expenses. From 2014 to 2023, Waste Management's SG&A expenses have consistently outpaced those of Quanta Services, with a peak in 2022 where they were approximately 45% higher. This trend underscores Waste Management's expansive operational scale, while Quanta Services has shown a remarkable 168% increase in SG&A expenses over the same period, reflecting its aggressive growth strategy. As we delve into these figures, it becomes evident that while both companies navigate the complexities of their industries, their financial strategies reveal distinct paths to maintaining competitive edges.
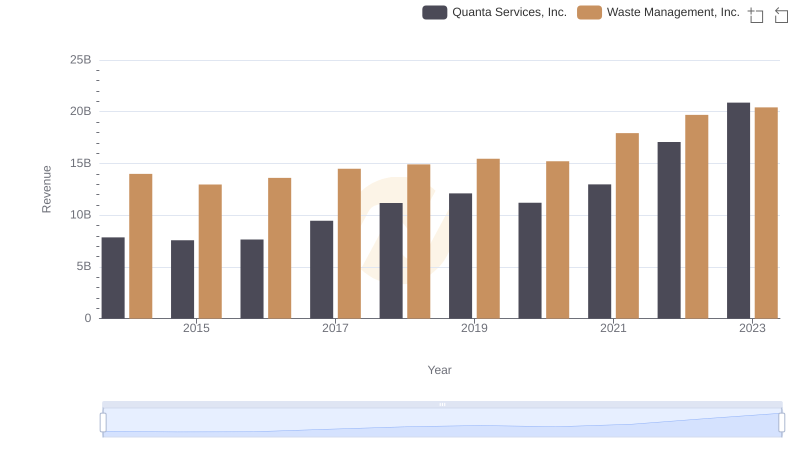
Waste Management, Inc. and Quanta Services, Inc.: A Comprehensive Revenue Analysis
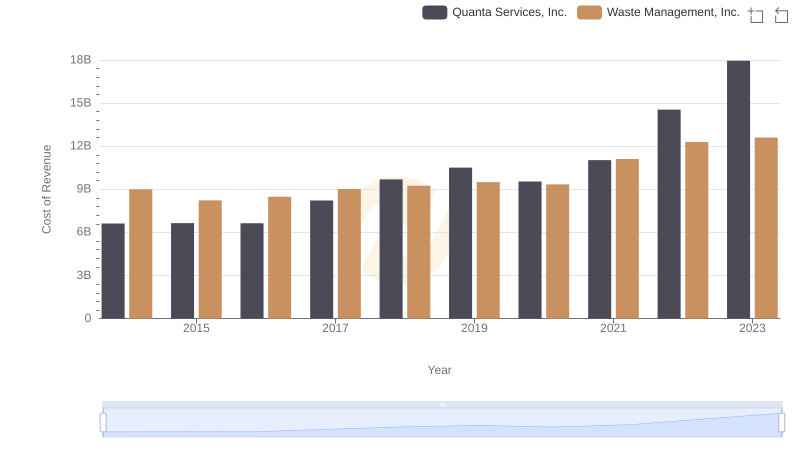
Cost of Revenue Comparison: Waste Management, Inc. vs Quanta Services, Inc.
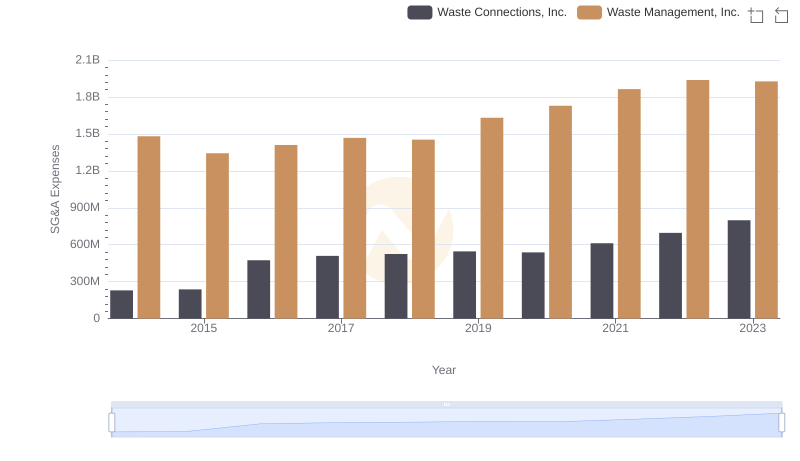
SG&A Efficiency Analysis: Comparing Waste Management, Inc. and Waste Connections, Inc.
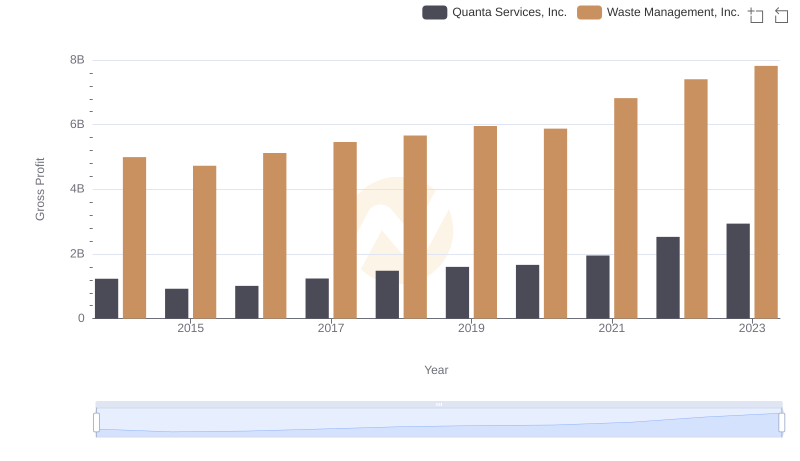
Waste Management, Inc. and Quanta Services, Inc.: A Detailed Gross Profit Analysis
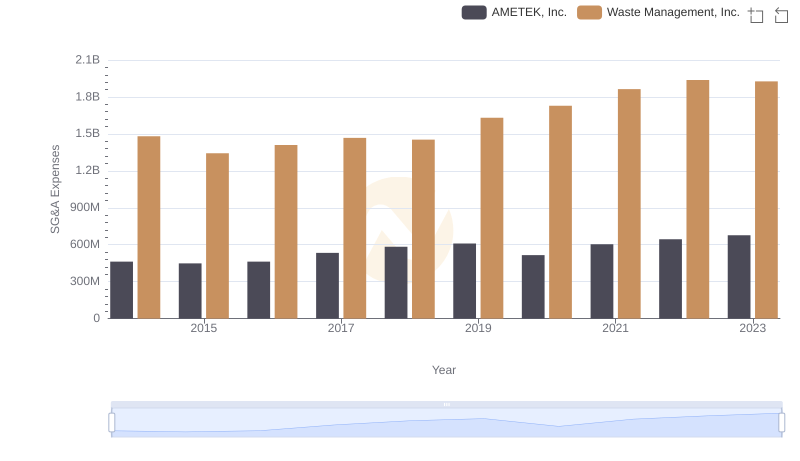
SG&A Efficiency Analysis: Comparing Waste Management, Inc. and AMETEK, Inc.
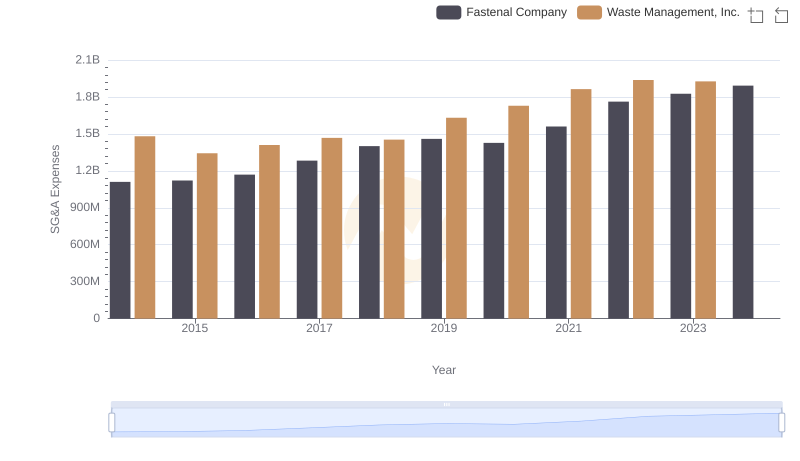
Waste Management, Inc. vs Fastenal Company: SG&A Expense Trends
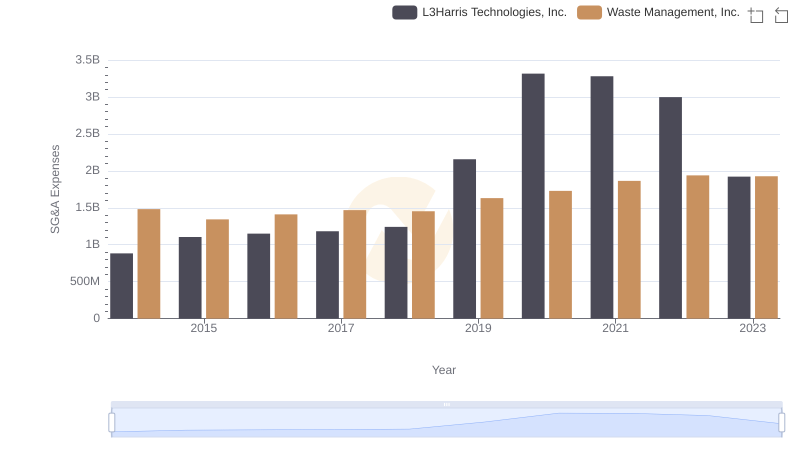
Selling, General, and Administrative Costs: Waste Management, Inc. vs L3Harris Technologies, Inc.
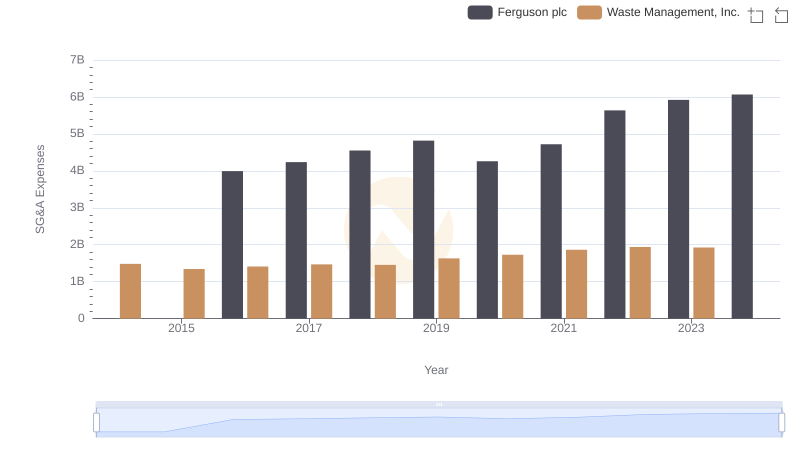
Breaking Down SG&A Expenses: Waste Management, Inc. vs Ferguson plc

SG&A Efficiency Analysis: Comparing Waste Management, Inc. and Old Dominion Freight Line, Inc.
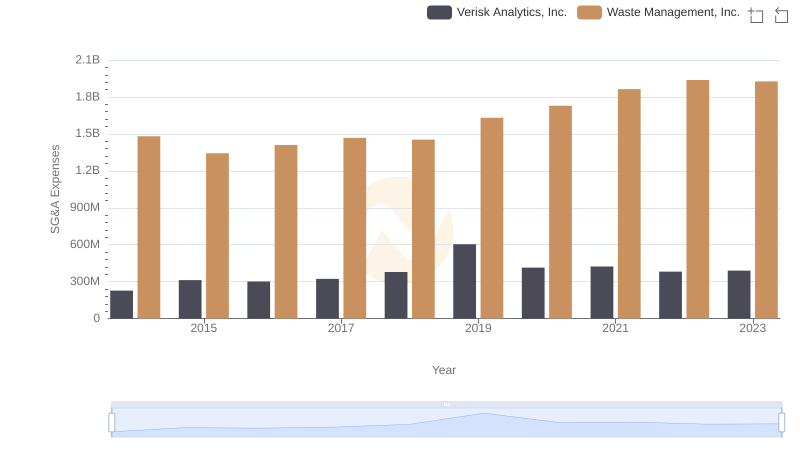
Breaking Down SG&A Expenses: Waste Management, Inc. vs Verisk Analytics, Inc.

Comparing SG&A Expenses: Waste Management, Inc. vs Ingersoll Rand Inc. Trends and Insights
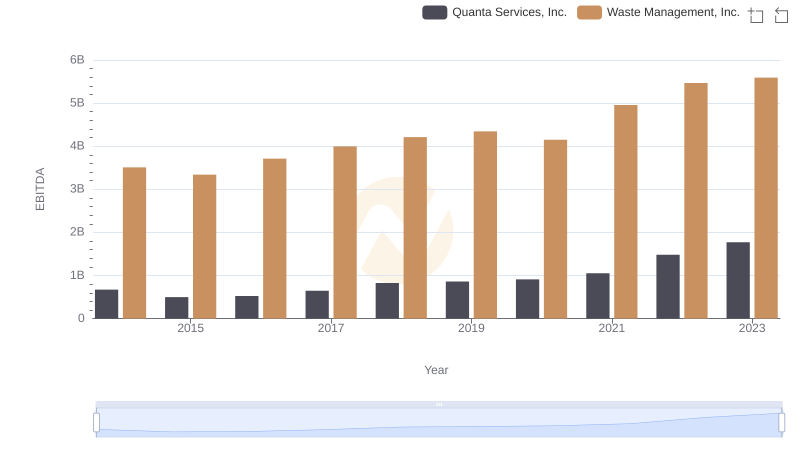
Professional EBITDA Benchmarking: Waste Management, Inc. vs Quanta Services, Inc.