| __timestamp | Fastenal Company | Waste Management, Inc. |
|---|---|---|
| Wednesday, January 1, 2014 | 1897402000 | 4994000000 |
| Thursday, January 1, 2015 | 1948934000 | 4730000000 |
| Friday, January 1, 2016 | 1964777000 | 5123000000 |
| Sunday, January 1, 2017 | 2163600000 | 5464000000 |
| Monday, January 1, 2018 | 2398900000 | 5665000000 |
| Tuesday, January 1, 2019 | 2515400000 | 5959000000 |
| Wednesday, January 1, 2020 | 2567800000 | 5877000000 |
| Friday, January 1, 2021 | 2777200000 | 6820000000 |
| Saturday, January 1, 2022 | 3215800000 | 7404000000 |
| Sunday, January 1, 2023 | 3354500000 | 7820000000 |
| Monday, January 1, 2024 | 3401900000 | 8680000000 |
Cracking the code
In the ever-evolving landscape of American industry, Waste Management, Inc. and Fastenal Company stand as titans in their respective fields. Over the past decade, from 2014 to 2023, these companies have showcased remarkable growth in gross profit, reflecting their strategic prowess and market adaptability.
Waste Management, Inc., a leader in environmental services, has seen its gross profit soar by approximately 57%, peaking at $7.82 billion in 2023. This growth underscores the increasing importance of sustainable waste solutions in today's eco-conscious world. Meanwhile, Fastenal Company, a key player in industrial supplies, has experienced a robust 79% increase, reaching $3.35 billion in 2023. This surge highlights the critical role of supply chain efficiency in modern manufacturing.
While 2024 data for Waste Management remains elusive, the upward trajectory of both companies is a testament to their enduring market influence.

Waste Management, Inc. vs Fastenal Company: Examining Key Revenue Metrics
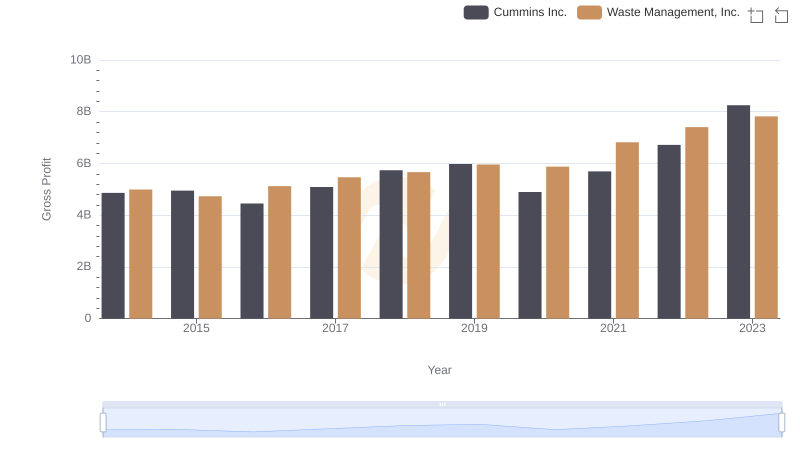
Who Generates Higher Gross Profit? Waste Management, Inc. or Cummins Inc.
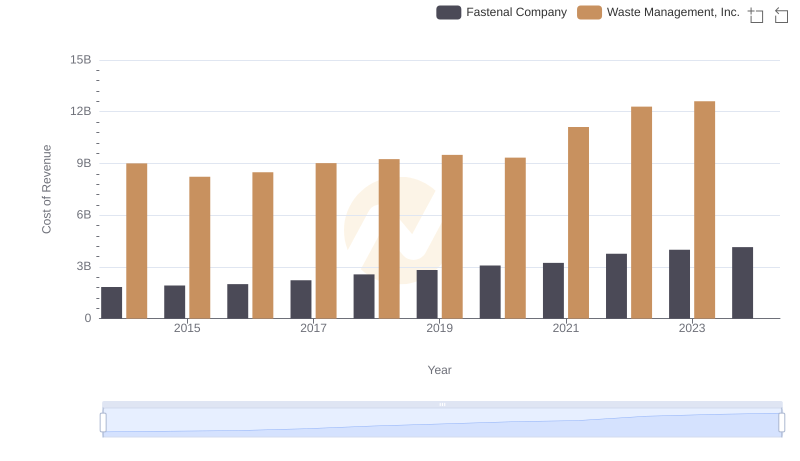
Comparing Cost of Revenue Efficiency: Waste Management, Inc. vs Fastenal Company
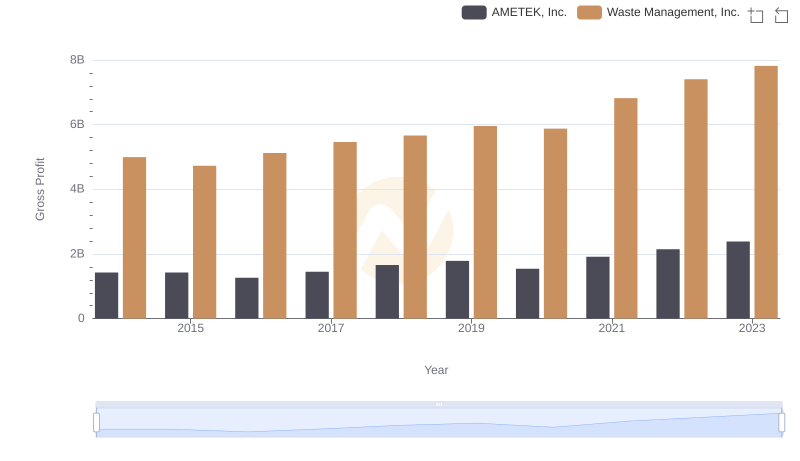
Waste Management, Inc. and AMETEK, Inc.: A Detailed Gross Profit Analysis
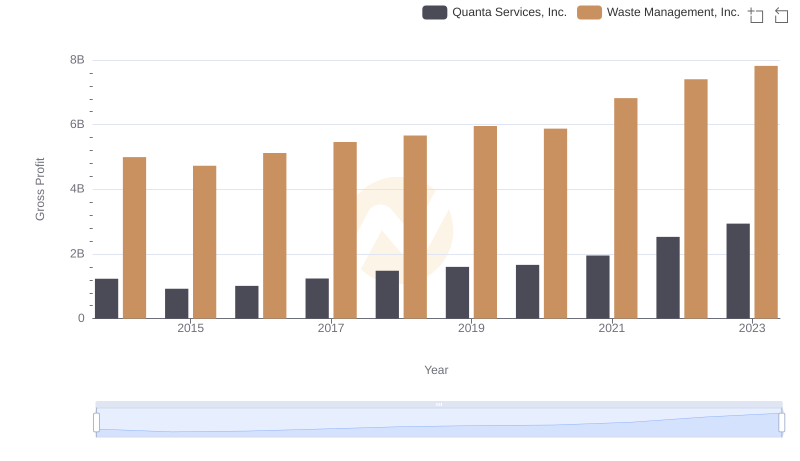
Waste Management, Inc. and Quanta Services, Inc.: A Detailed Gross Profit Analysis
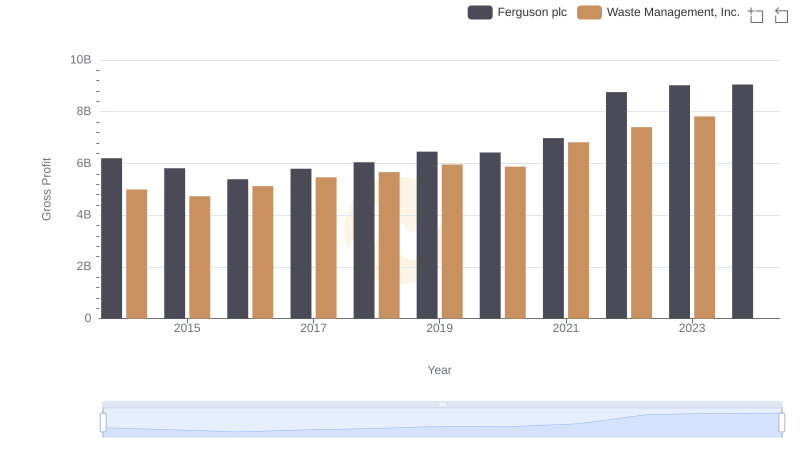
Gross Profit Trends Compared: Waste Management, Inc. vs Ferguson plc
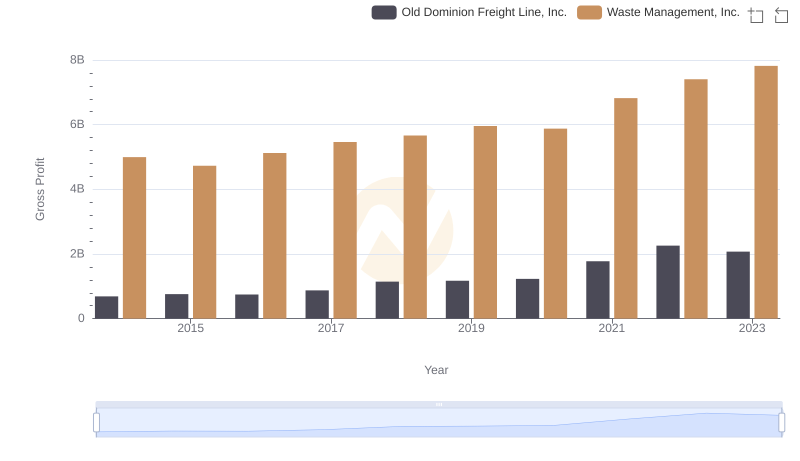
Who Generates Higher Gross Profit? Waste Management, Inc. or Old Dominion Freight Line, Inc.
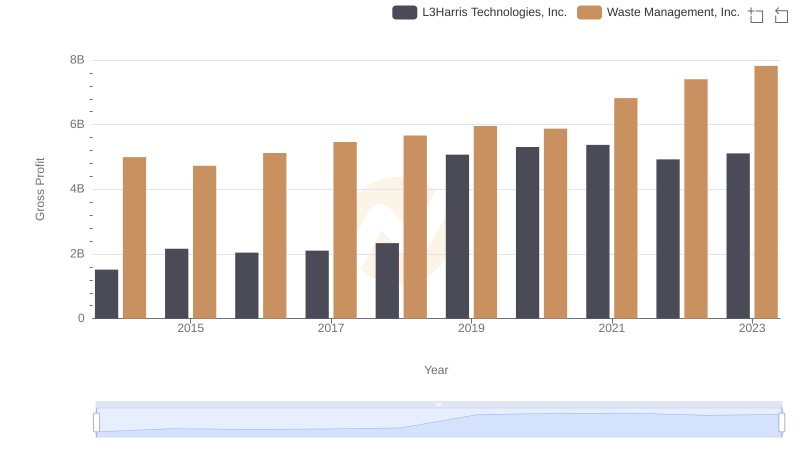
Who Generates Higher Gross Profit? Waste Management, Inc. or L3Harris Technologies, Inc.
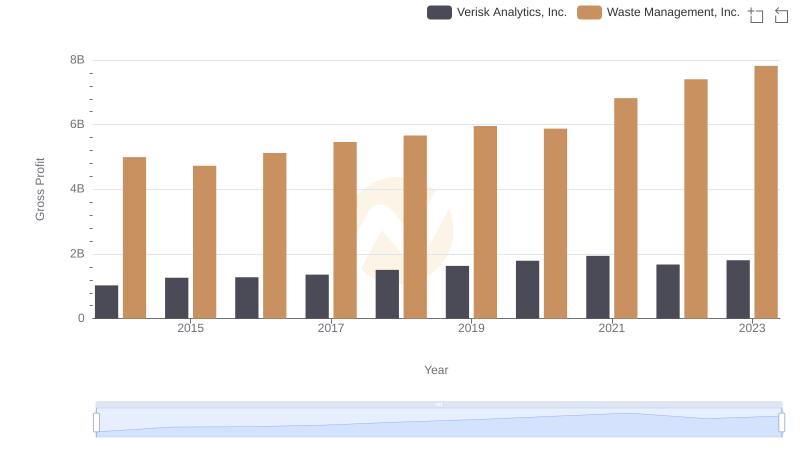
Key Insights on Gross Profit: Waste Management, Inc. vs Verisk Analytics, Inc.
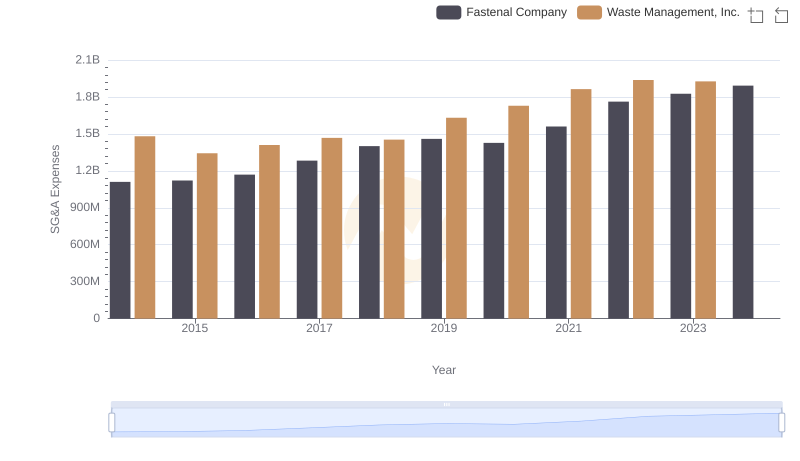
Waste Management, Inc. vs Fastenal Company: SG&A Expense Trends
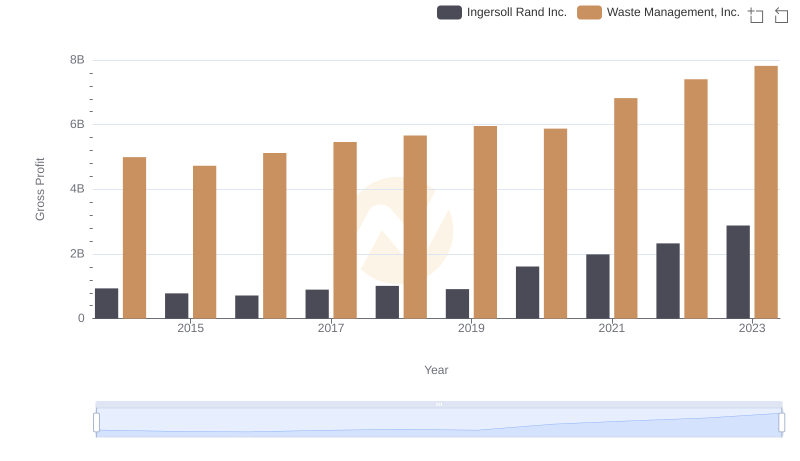
Key Insights on Gross Profit: Waste Management, Inc. vs Ingersoll Rand Inc.
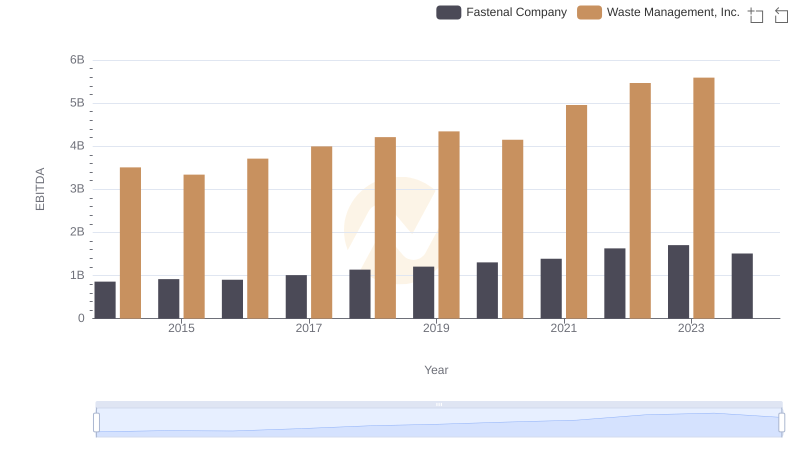
EBITDA Analysis: Evaluating Waste Management, Inc. Against Fastenal Company