| __timestamp | Verisk Analytics, Inc. | Waste Management, Inc. |
|---|---|---|
| Wednesday, January 1, 2014 | 227306000 | 1481000000 |
| Thursday, January 1, 2015 | 312690000 | 1343000000 |
| Friday, January 1, 2016 | 301600000 | 1410000000 |
| Sunday, January 1, 2017 | 322800000 | 1468000000 |
| Monday, January 1, 2018 | 378700000 | 1453000000 |
| Tuesday, January 1, 2019 | 603500000 | 1631000000 |
| Wednesday, January 1, 2020 | 413900000 | 1728000000 |
| Friday, January 1, 2021 | 422700000 | 1864000000 |
| Saturday, January 1, 2022 | 381500000 | 1938000000 |
| Sunday, January 1, 2023 | 389300000 | 1926000000 |
| Monday, January 1, 2024 | 2264000000 |
Igniting the spark of knowledge
In the ever-evolving landscape of corporate finance, understanding the nuances of Selling, General, and Administrative (SG&A) expenses is crucial. Over the past decade, Waste Management, Inc. and Verisk Analytics, Inc. have showcased distinct financial strategies. From 2014 to 2023, Waste Management's SG&A expenses have consistently been higher, peaking at nearly $1.93 billion in 2022, reflecting a robust operational scale. In contrast, Verisk Analytics, Inc. saw a significant rise in 2019, with expenses reaching approximately $603 million, marking a 90% increase from 2014. This divergence highlights Waste Management's expansive operational footprint compared to Verisk's more streamlined approach. As businesses navigate the complexities of financial management, these insights offer a window into strategic cost management, emphasizing the importance of tailored financial strategies in achieving corporate success.
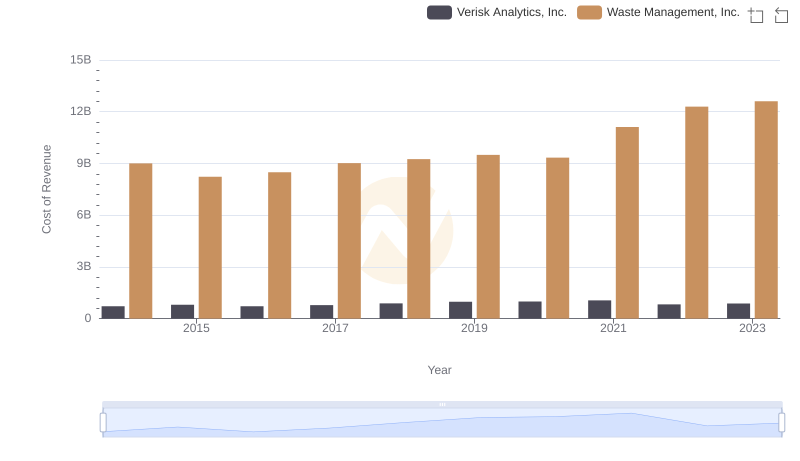
Comparing Cost of Revenue Efficiency: Waste Management, Inc. vs Verisk Analytics, Inc.
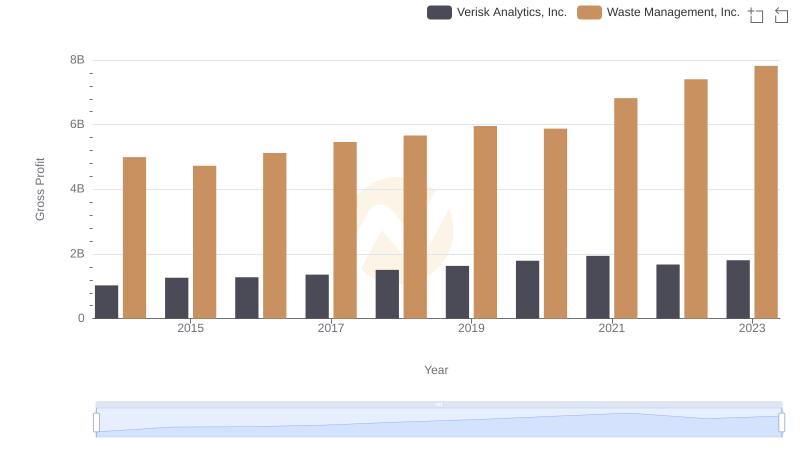
Key Insights on Gross Profit: Waste Management, Inc. vs Verisk Analytics, Inc.
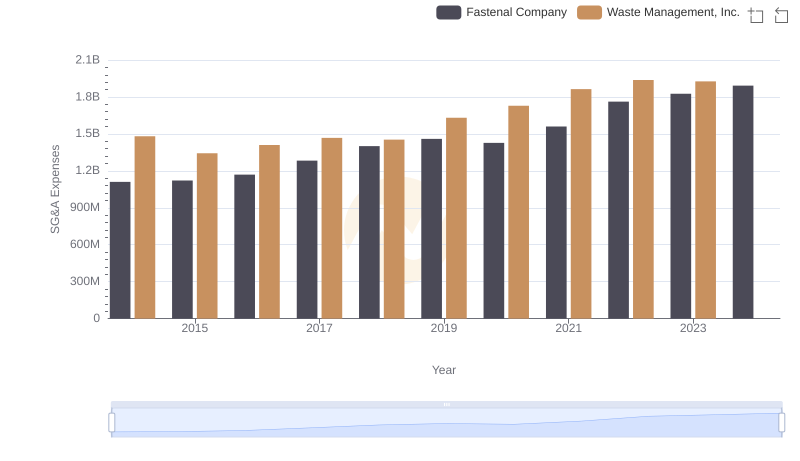
Waste Management, Inc. vs Fastenal Company: SG&A Expense Trends
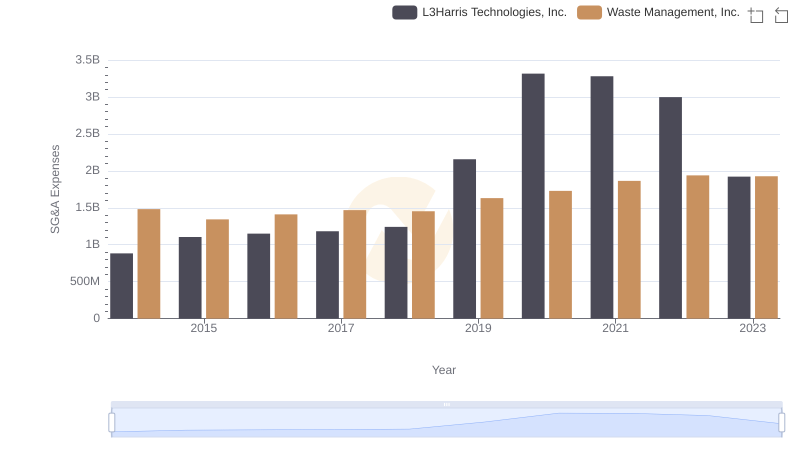
Selling, General, and Administrative Costs: Waste Management, Inc. vs L3Harris Technologies, Inc.
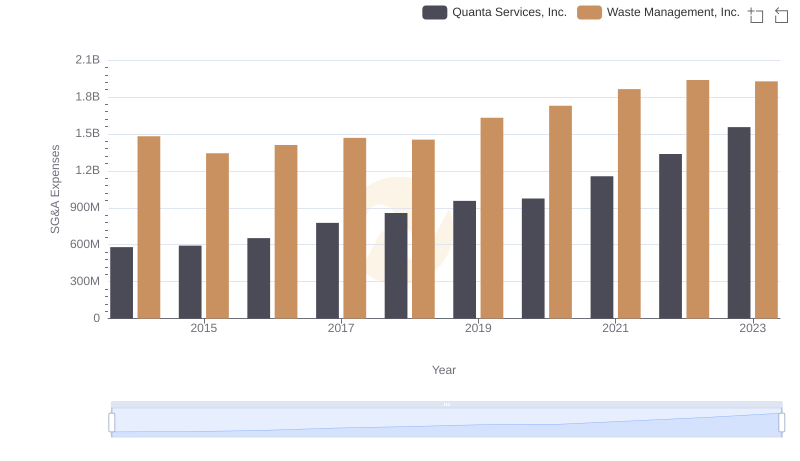
Operational Costs Compared: SG&A Analysis of Waste Management, Inc. and Quanta Services, Inc.
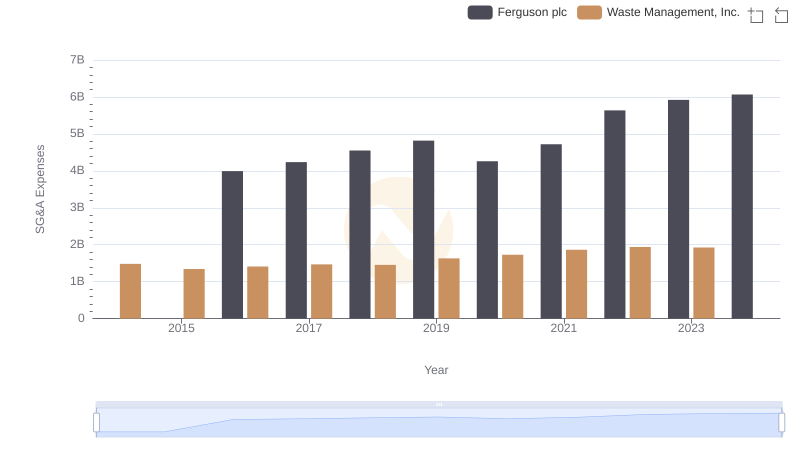
Breaking Down SG&A Expenses: Waste Management, Inc. vs Ferguson plc

SG&A Efficiency Analysis: Comparing Waste Management, Inc. and Old Dominion Freight Line, Inc.

Comparing SG&A Expenses: Waste Management, Inc. vs Ingersoll Rand Inc. Trends and Insights
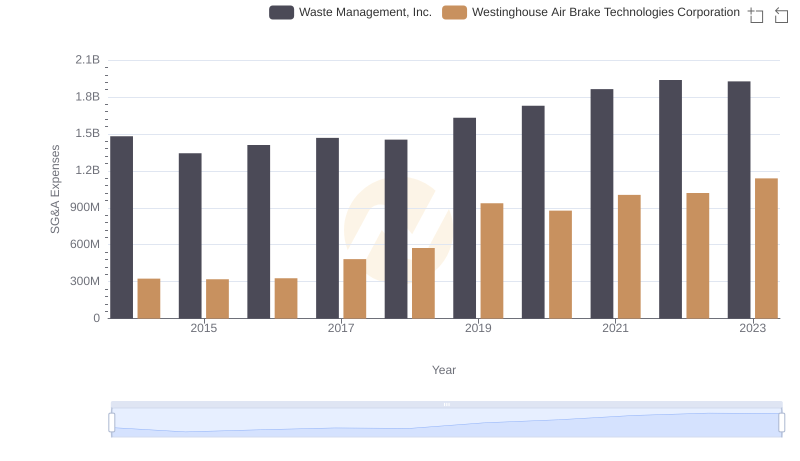
Who Optimizes SG&A Costs Better? Waste Management, Inc. or Westinghouse Air Brake Technologies Corporation
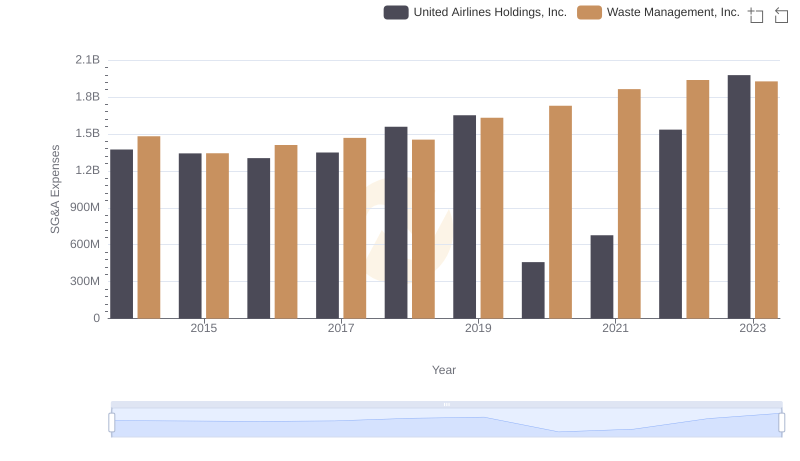
Waste Management, Inc. vs United Airlines Holdings, Inc.: SG&A Expense Trends
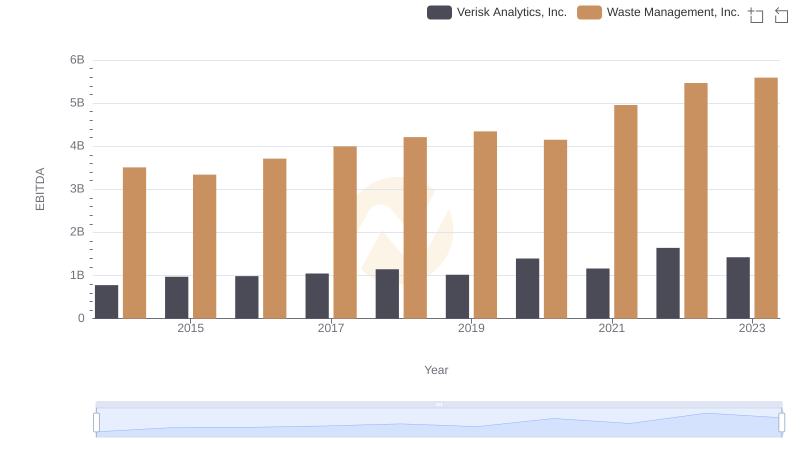
A Professional Review of EBITDA: Waste Management, Inc. Compared to Verisk Analytics, Inc.