| __timestamp | Waste Connections, Inc. | Waste Management, Inc. |
|---|---|---|
| Wednesday, January 1, 2014 | 229474000 | 1481000000 |
| Thursday, January 1, 2015 | 237484000 | 1343000000 |
| Friday, January 1, 2016 | 474263000 | 1410000000 |
| Sunday, January 1, 2017 | 509638000 | 1468000000 |
| Monday, January 1, 2018 | 524388000 | 1453000000 |
| Tuesday, January 1, 2019 | 546278000 | 1631000000 |
| Wednesday, January 1, 2020 | 537632000 | 1728000000 |
| Friday, January 1, 2021 | 612337000 | 1864000000 |
| Saturday, January 1, 2022 | 696467000 | 1938000000 |
| Sunday, January 1, 2023 | 799119000 | 1926000000 |
| Monday, January 1, 2024 | 883445000 | 2264000000 |
Unleashing insights
In the world of waste management, two titans stand out: Waste Management, Inc. and Waste Connections, Inc. Over the past decade, these companies have demonstrated distinct strategies in managing their Selling, General, and Administrative (SG&A) expenses. From 2014 to 2023, Waste Management, Inc. consistently maintained higher SG&A expenses, peaking at nearly $1.93 billion in 2022. In contrast, Waste Connections, Inc. showed a more dynamic growth, with SG&A expenses rising from approximately $229 million in 2014 to nearly $799 million in 2023, marking a staggering 250% increase. This divergence highlights Waste Connections' aggressive expansion and operational scaling. As the industry evolves, understanding these financial strategies offers valuable insights into corporate efficiency and market positioning. Dive deeper into the numbers to explore how these giants balance cost management with growth ambitions.
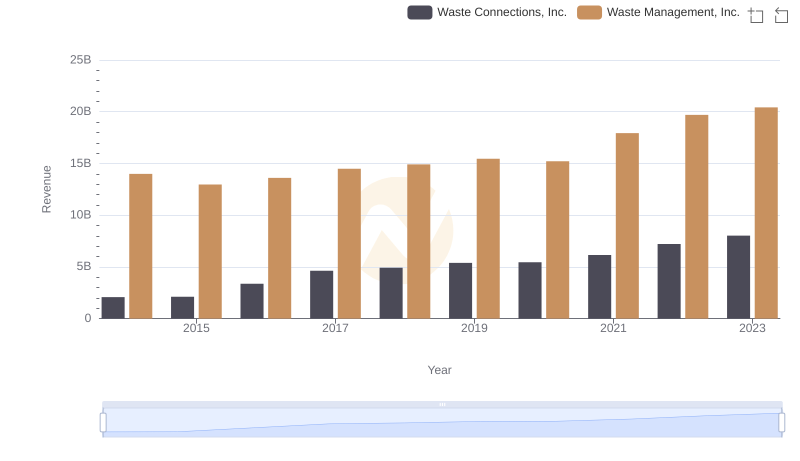
Who Generates More Revenue? Waste Management, Inc. or Waste Connections, Inc.
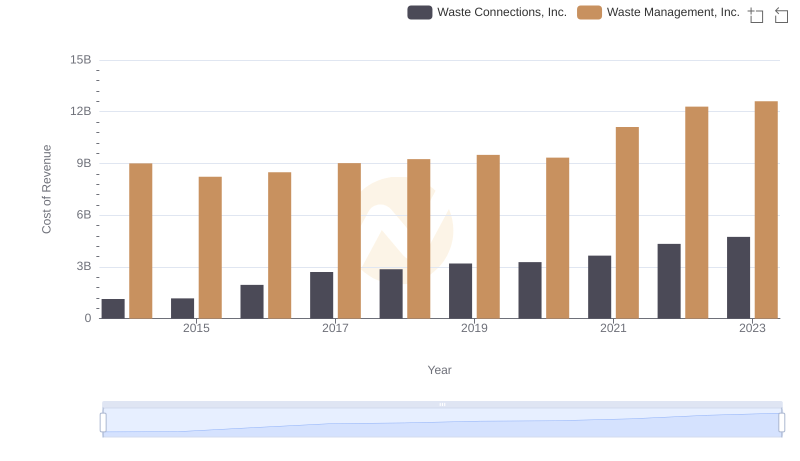
Waste Management, Inc. vs Waste Connections, Inc.: Efficiency in Cost of Revenue Explored
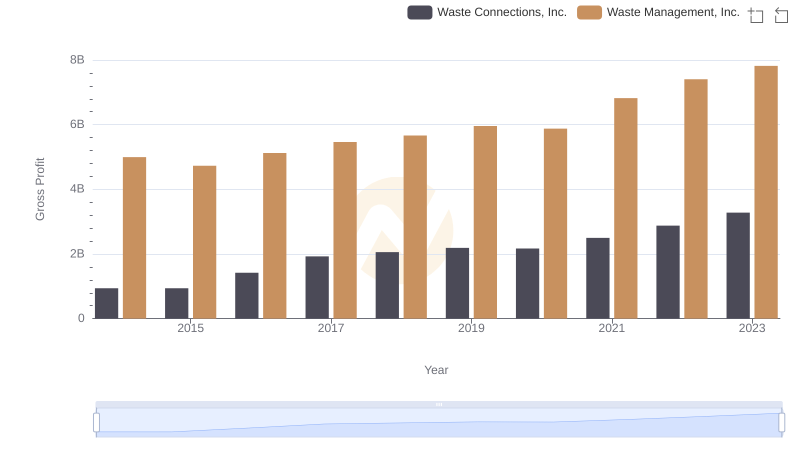
Waste Management, Inc. and Waste Connections, Inc.: A Detailed Gross Profit Analysis
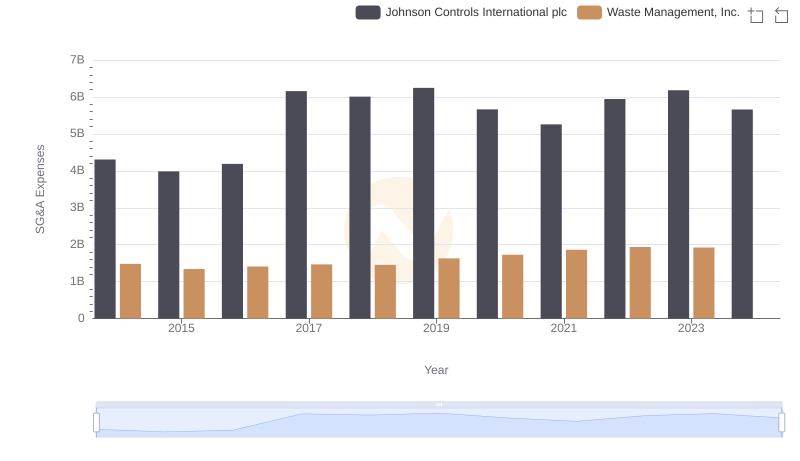
Waste Management, Inc. and Johnson Controls International plc: SG&A Spending Patterns Compared
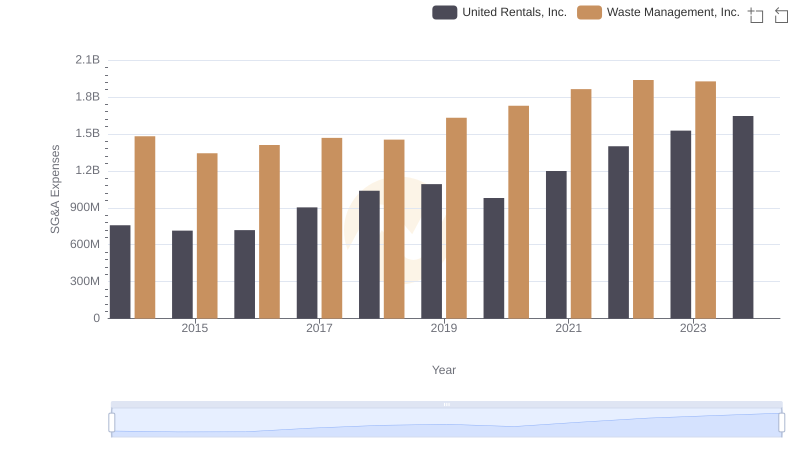
Selling, General, and Administrative Costs: Waste Management, Inc. vs United Rentals, Inc.
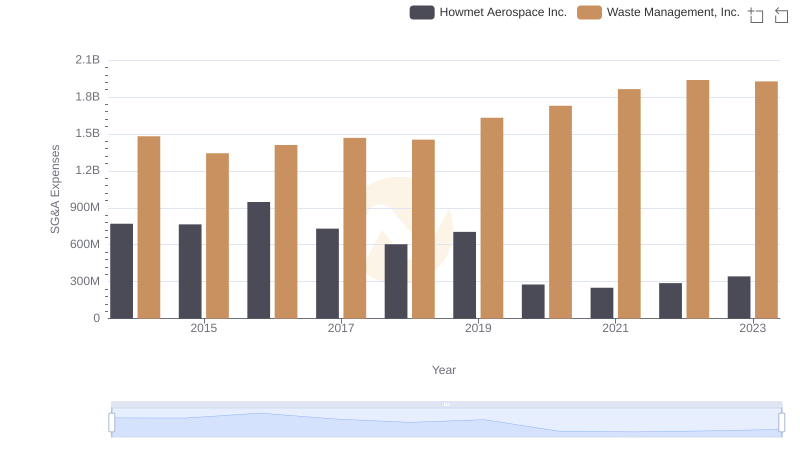
Cost Management Insights: SG&A Expenses for Waste Management, Inc. and Howmet Aerospace Inc.
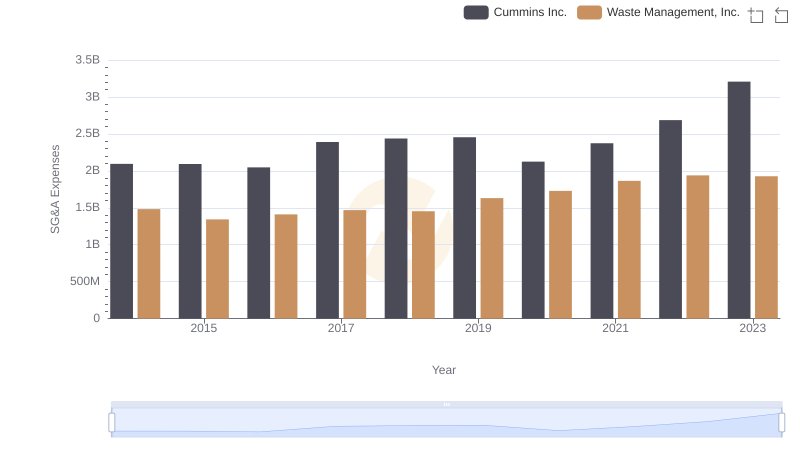
Breaking Down SG&A Expenses: Waste Management, Inc. vs Cummins Inc.
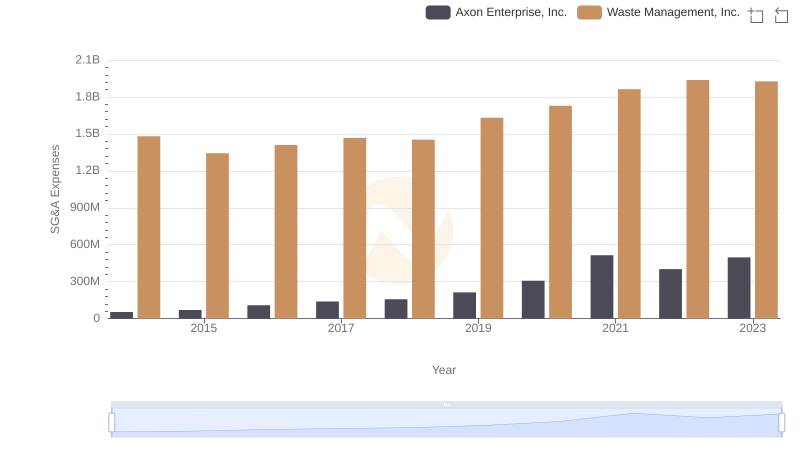
Who Optimizes SG&A Costs Better? Waste Management, Inc. or Axon Enterprise, Inc.
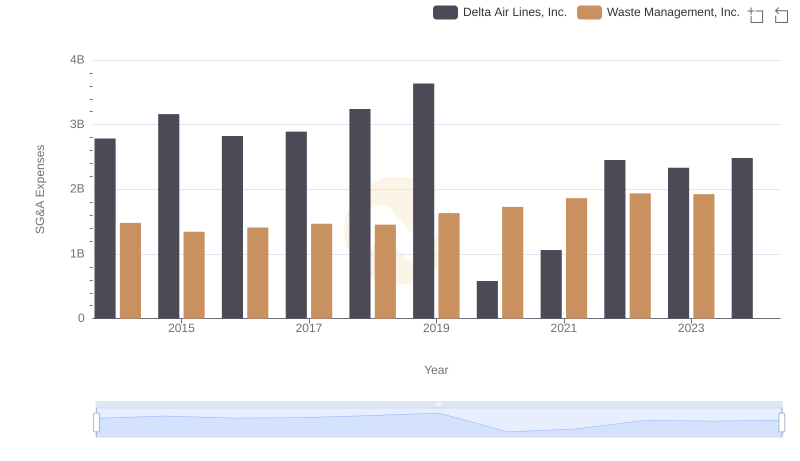
Waste Management, Inc. or Delta Air Lines, Inc.: Who Manages SG&A Costs Better?
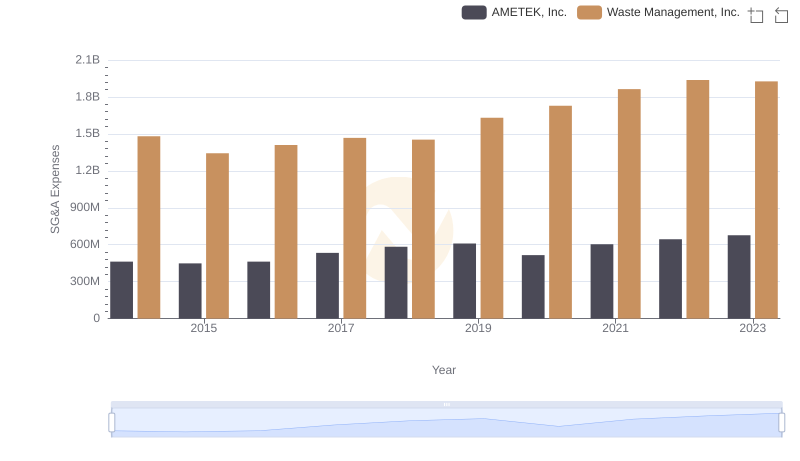
SG&A Efficiency Analysis: Comparing Waste Management, Inc. and AMETEK, Inc.
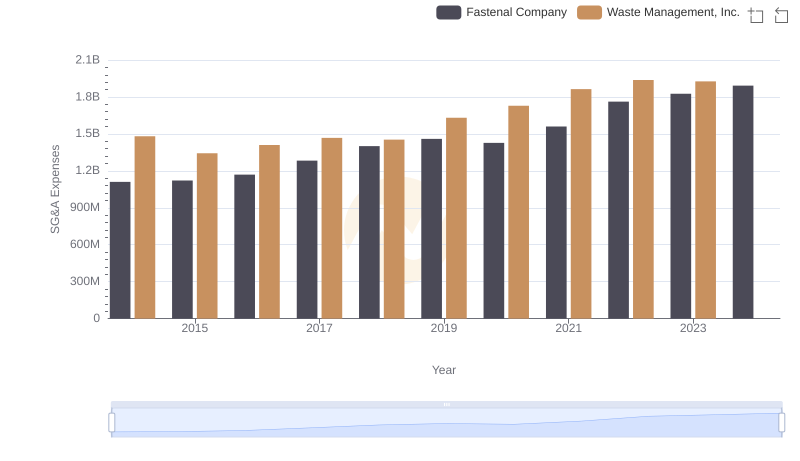
Waste Management, Inc. vs Fastenal Company: SG&A Expense Trends
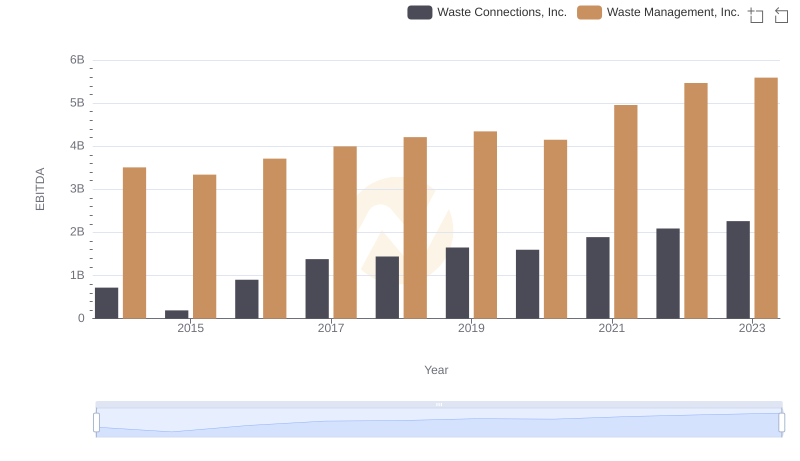
A Side-by-Side Analysis of EBITDA: Waste Management, Inc. and Waste Connections, Inc.