| __timestamp | Global Payments Inc. | Waste Management, Inc. |
|---|---|---|
| Wednesday, January 1, 2014 | 1751611000 | 4994000000 |
| Thursday, January 1, 2015 | 1750511000 | 4730000000 |
| Friday, January 1, 2016 | 1767444000 | 5123000000 |
| Sunday, January 1, 2017 | 2047126000 | 5464000000 |
| Monday, January 1, 2018 | 2271352000 | 5665000000 |
| Tuesday, January 1, 2019 | 2838089000 | 5959000000 |
| Wednesday, January 1, 2020 | 3772831000 | 5877000000 |
| Friday, January 1, 2021 | 4750037000 | 6820000000 |
| Saturday, January 1, 2022 | 5196898000 | 7404000000 |
| Sunday, January 1, 2023 | 5926898000 | 7820000000 |
| Monday, January 1, 2024 | 6345778000 | 8680000000 |
Data in motion
In the ever-evolving landscape of corporate finance, understanding the trajectory of gross profits is crucial for investors and stakeholders. Over the past decade, Waste Management, Inc. and Global Payments Inc. have demonstrated distinct growth patterns in their gross profits. From 2014 to 2023, Waste Management, Inc. has seen a steady increase, with a notable 57% rise from approximately $5 billion in 2014 to nearly $7.8 billion in 2023. This growth underscores the company's robust operational efficiency and market dominance in the waste management sector.
Conversely, Global Payments Inc. has experienced a more dynamic growth curve, with gross profits surging by 238% from around $1.75 billion in 2014 to approximately $5.93 billion in 2023. This remarkable increase highlights the company's strategic expansions and innovations in the global payments industry. As these trends unfold, stakeholders are keenly observing how these giants will navigate future challenges and opportunities.
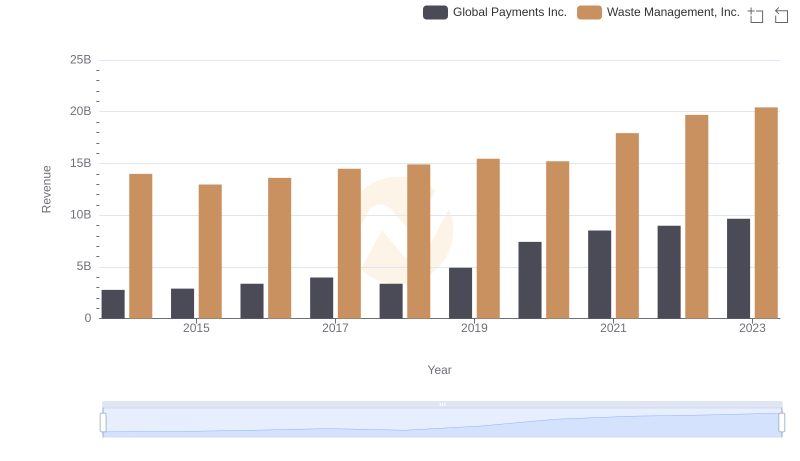
Revenue Showdown: Waste Management, Inc. vs Global Payments Inc.
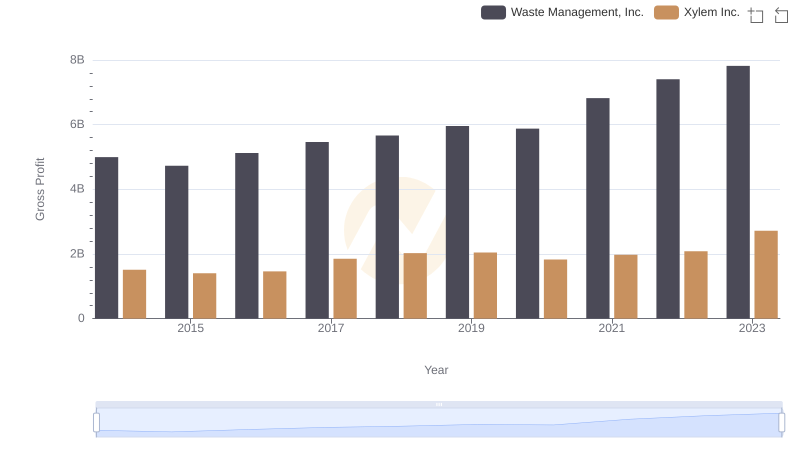
Gross Profit Trends Compared: Waste Management, Inc. vs Xylem Inc.
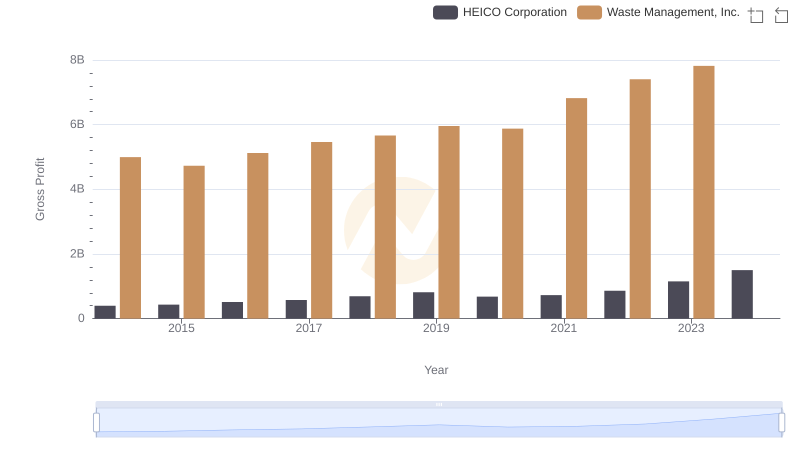
Gross Profit Analysis: Comparing Waste Management, Inc. and HEICO Corporation
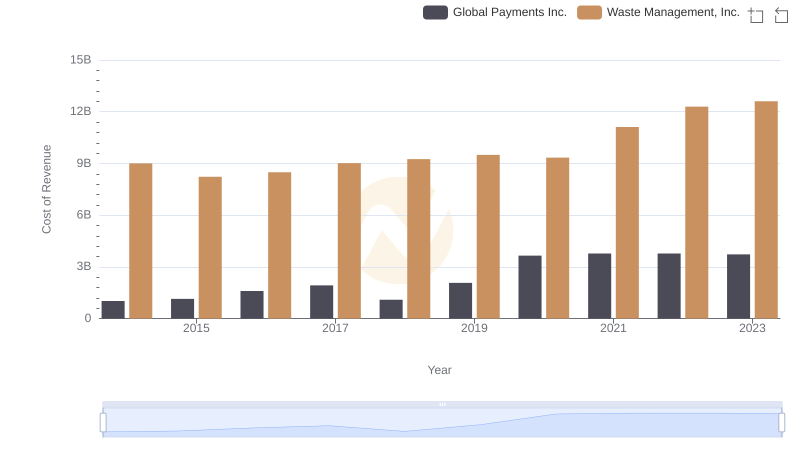
Cost of Revenue Trends: Waste Management, Inc. vs Global Payments Inc.
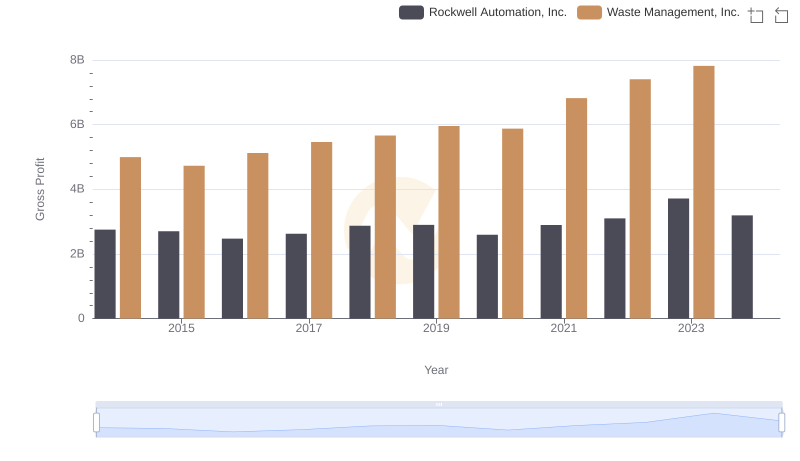
Gross Profit Comparison: Waste Management, Inc. and Rockwell Automation, Inc. Trends
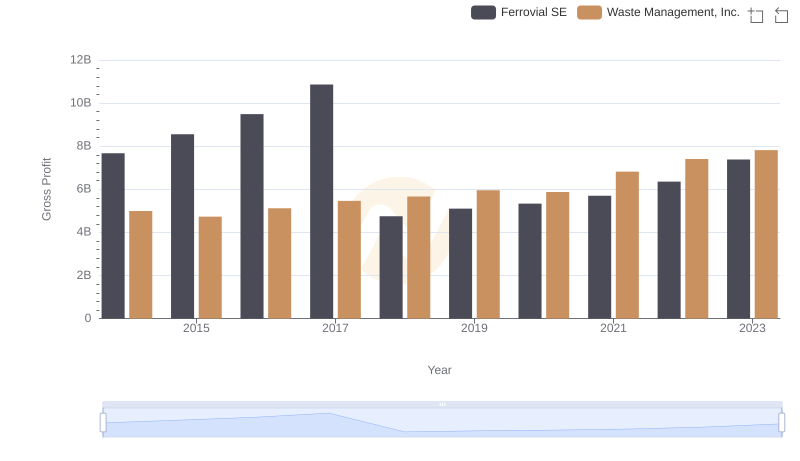
Key Insights on Gross Profit: Waste Management, Inc. vs Ferrovial SE
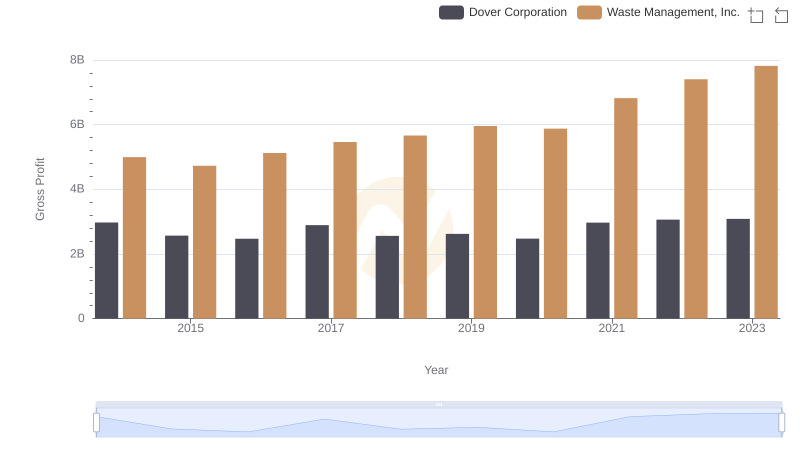
Waste Management, Inc. and Dover Corporation: A Detailed Gross Profit Analysis
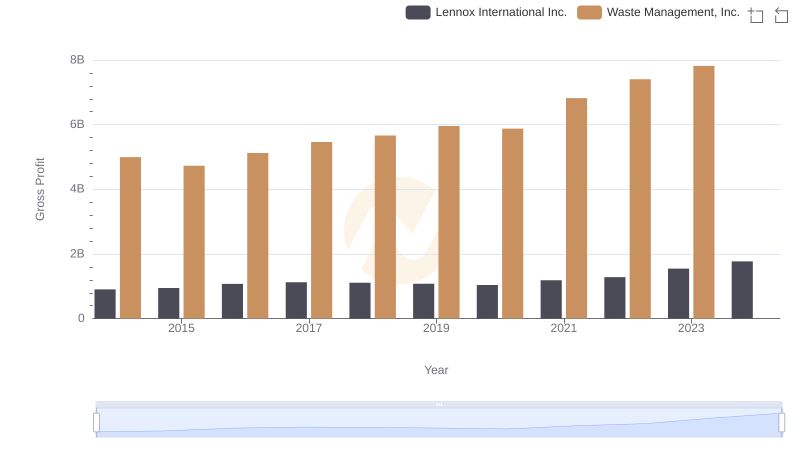
Gross Profit Comparison: Waste Management, Inc. and Lennox International Inc. Trends
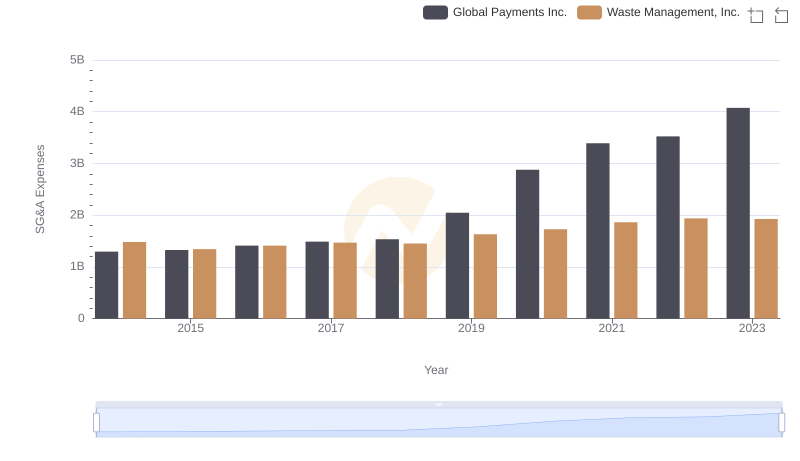
Waste Management, Inc. vs Global Payments Inc.: SG&A Expense Trends
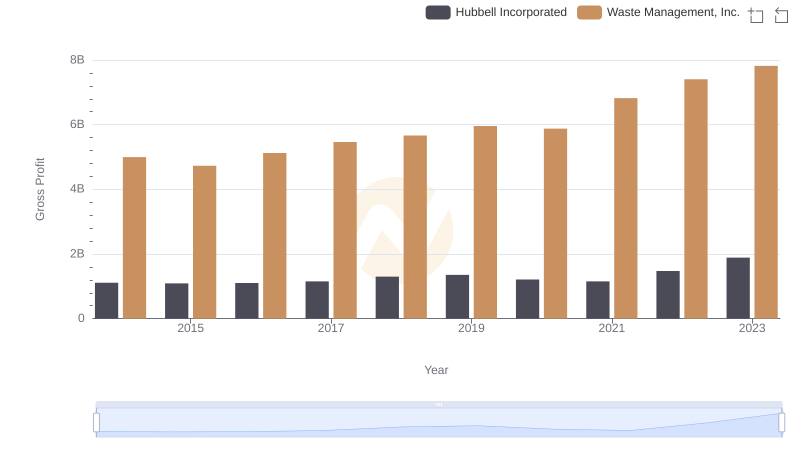
Waste Management, Inc. vs Hubbell Incorporated: A Gross Profit Performance Breakdown
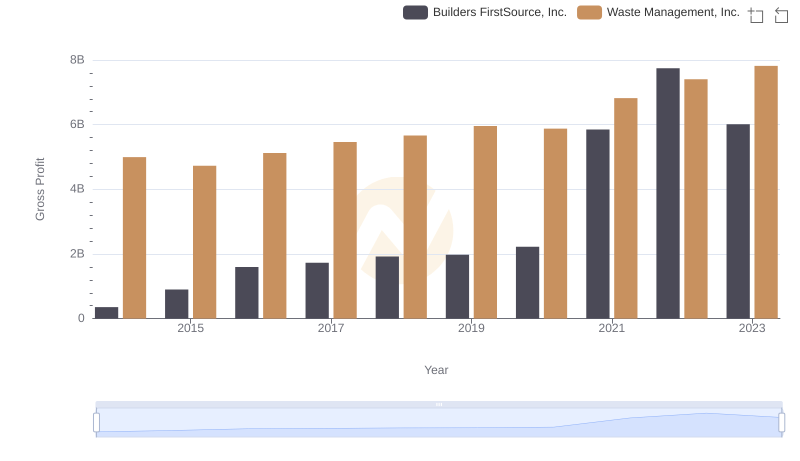
Gross Profit Comparison: Waste Management, Inc. and Builders FirstSource, Inc. Trends
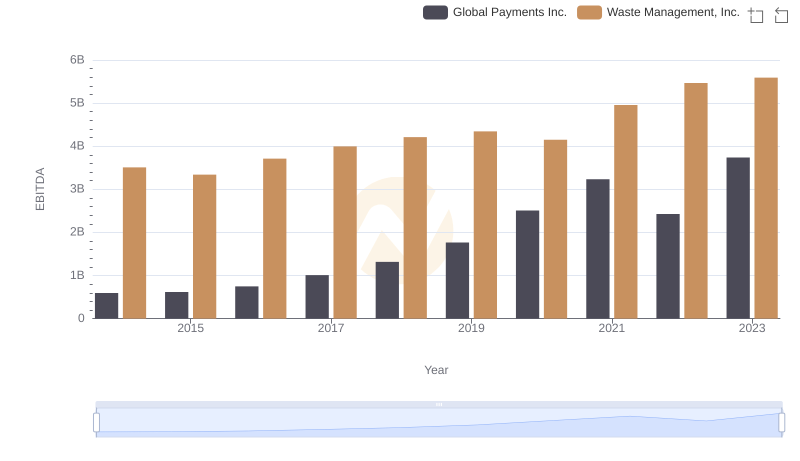
A Professional Review of EBITDA: Waste Management, Inc. Compared to Global Payments Inc.