| __timestamp | Waste Management, Inc. | Xylem Inc. |
|---|---|---|
| Wednesday, January 1, 2014 | 4994000000 | 1513000000 |
| Thursday, January 1, 2015 | 4730000000 | 1404000000 |
| Friday, January 1, 2016 | 5123000000 | 1461000000 |
| Sunday, January 1, 2017 | 5464000000 | 1851000000 |
| Monday, January 1, 2018 | 5665000000 | 2026000000 |
| Tuesday, January 1, 2019 | 5959000000 | 2046000000 |
| Wednesday, January 1, 2020 | 5877000000 | 1830000000 |
| Friday, January 1, 2021 | 6820000000 | 1975000000 |
| Saturday, January 1, 2022 | 7404000000 | 2084000000 |
| Sunday, January 1, 2023 | 7820000000 | 2717000000 |
| Monday, January 1, 2024 | 8680000000 |
Unlocking the unknown
In the ever-evolving landscape of environmental services and water technology, Waste Management, Inc. and Xylem Inc. have shown distinct trajectories in their gross profit trends over the past decade. From 2014 to 2023, Waste Management, Inc. has seen a robust growth of approximately 57%, with its gross profit rising from around $5 billion to nearly $7.8 billion. This reflects the company's strategic expansion and operational efficiency in waste management services across North America.
Conversely, Xylem Inc., a leader in water technology, has experienced a more modest increase of about 80% in the same period, growing from $1.5 billion to $2.7 billion. This growth underscores the increasing global demand for sustainable water solutions. As we look to the future, these trends highlight the critical role both companies play in addressing environmental challenges and their potential for continued growth.
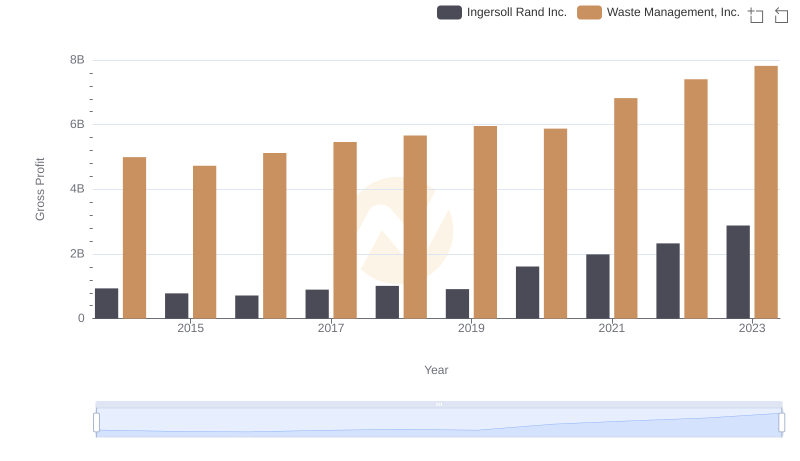
Key Insights on Gross Profit: Waste Management, Inc. vs Ingersoll Rand Inc.
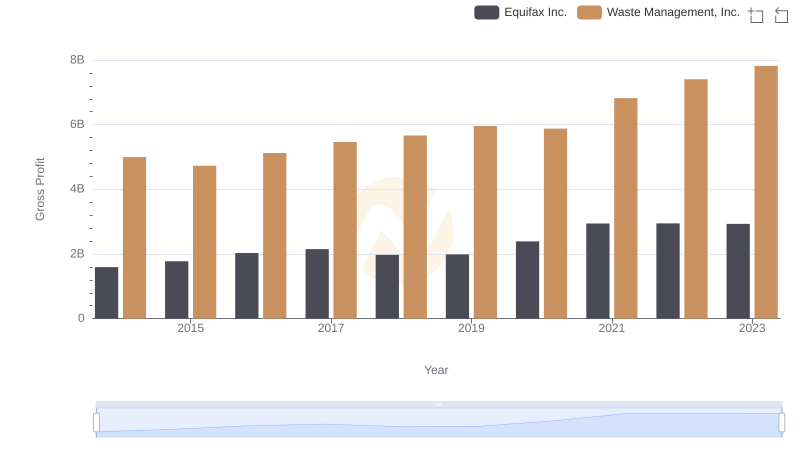
Gross Profit Trends Compared: Waste Management, Inc. vs Equifax Inc.
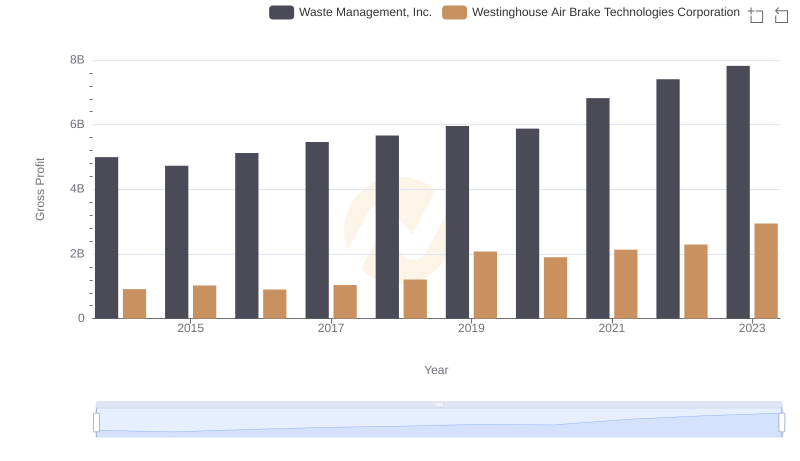
Who Generates Higher Gross Profit? Waste Management, Inc. or Westinghouse Air Brake Technologies Corporation
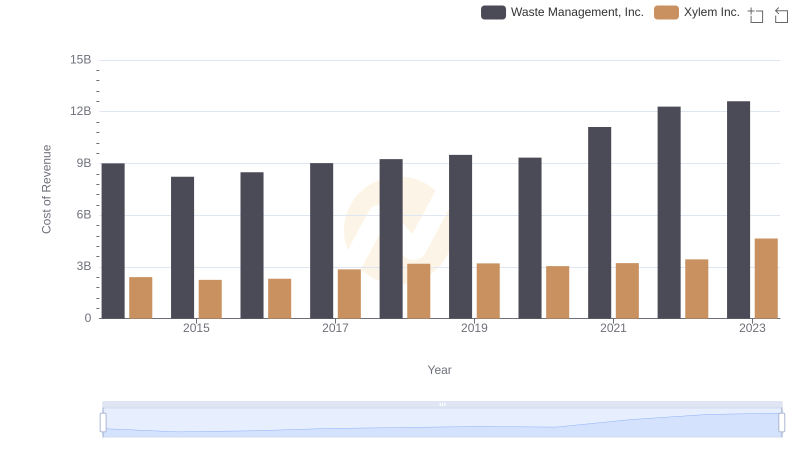
Cost of Revenue: Key Insights for Waste Management, Inc. and Xylem Inc.
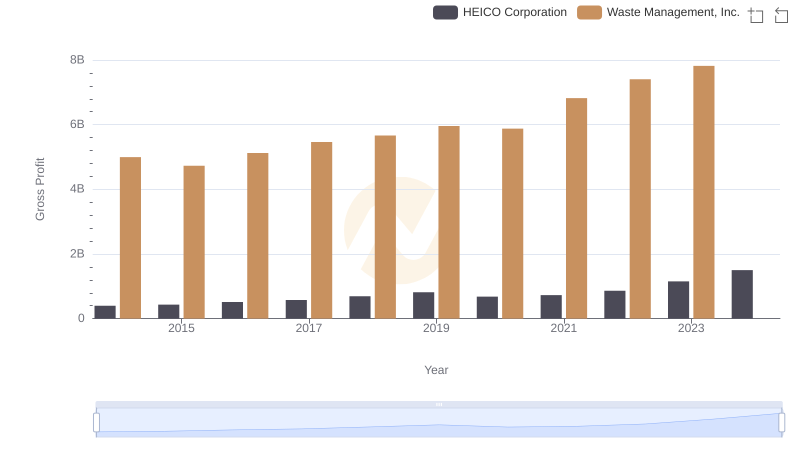
Gross Profit Analysis: Comparing Waste Management, Inc. and HEICO Corporation
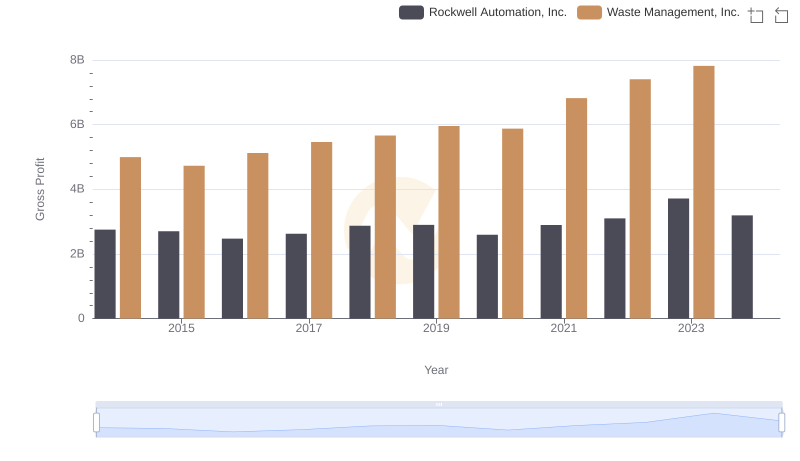
Gross Profit Comparison: Waste Management, Inc. and Rockwell Automation, Inc. Trends
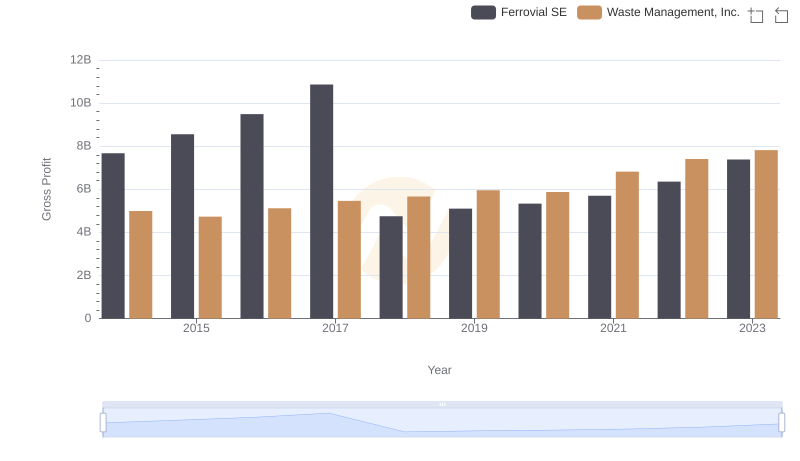
Key Insights on Gross Profit: Waste Management, Inc. vs Ferrovial SE

Waste Management, Inc. and Global Payments Inc.: A Detailed Gross Profit Analysis
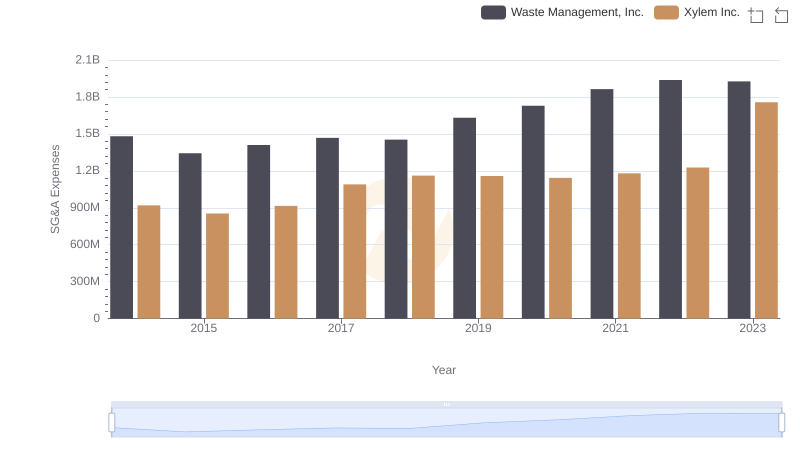
Breaking Down SG&A Expenses: Waste Management, Inc. vs Xylem Inc.
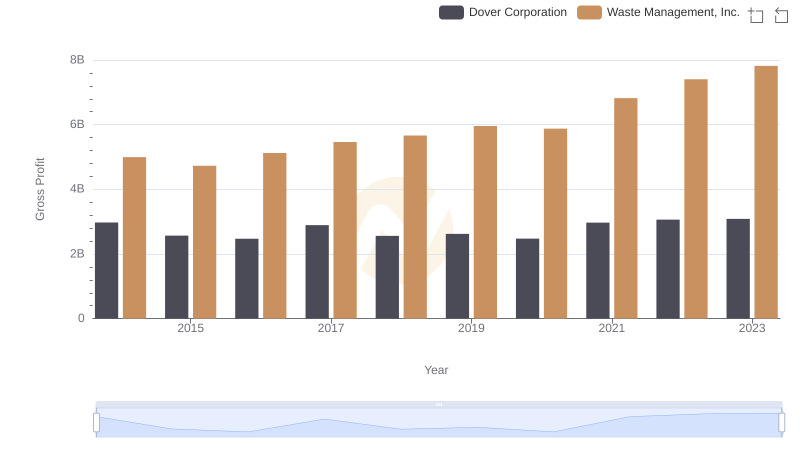
Waste Management, Inc. and Dover Corporation: A Detailed Gross Profit Analysis