| __timestamp | Dover Corporation | Waste Management, Inc. |
|---|---|---|
| Wednesday, January 1, 2014 | 2974249000 | 4994000000 |
| Thursday, January 1, 2015 | 2568144000 | 4730000000 |
| Friday, January 1, 2016 | 2471969000 | 5123000000 |
| Sunday, January 1, 2017 | 2890377000 | 5464000000 |
| Monday, January 1, 2018 | 2559556000 | 5665000000 |
| Tuesday, January 1, 2019 | 2620938000 | 5959000000 |
| Wednesday, January 1, 2020 | 2474019000 | 5877000000 |
| Friday, January 1, 2021 | 2969786000 | 6820000000 |
| Saturday, January 1, 2022 | 3063556000 | 7404000000 |
| Sunday, January 1, 2023 | 3084633000 | 7820000000 |
| Monday, January 1, 2024 | 2958621000 | 8680000000 |
Unleashing the power of data
In the ever-evolving landscape of industrial services, Waste Management, Inc. and Dover Corporation stand as titans, each carving a unique path to profitability. Over the past decade, Waste Management has consistently outperformed Dover in terms of gross profit, showcasing a robust growth trajectory. From 2014 to 2023, Waste Management's gross profit surged by approximately 57%, peaking at an impressive $7.82 billion in 2023. In contrast, Dover Corporation experienced a more modest growth of around 4%, reaching $3.08 billion in the same year.
This analysis highlights the strategic prowess of Waste Management in capitalizing on market opportunities, while Dover's steady performance underscores its resilience in a competitive environment. As we delve deeper into these financial narratives, the data reveals not just numbers, but stories of innovation, adaptation, and market leadership.
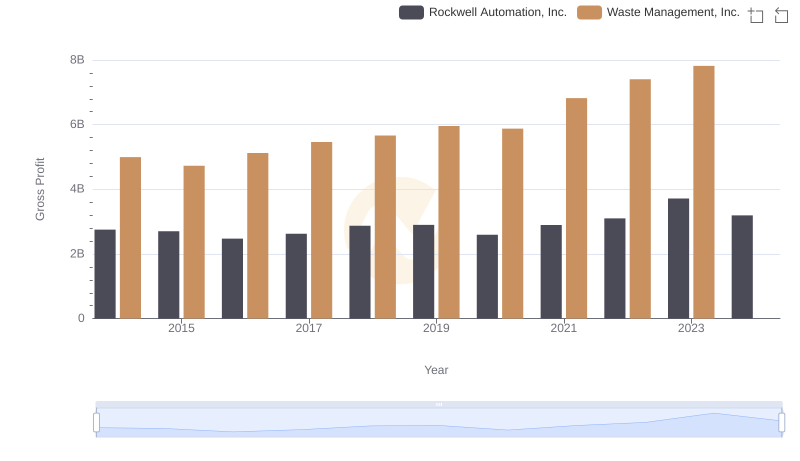
Gross Profit Comparison: Waste Management, Inc. and Rockwell Automation, Inc. Trends
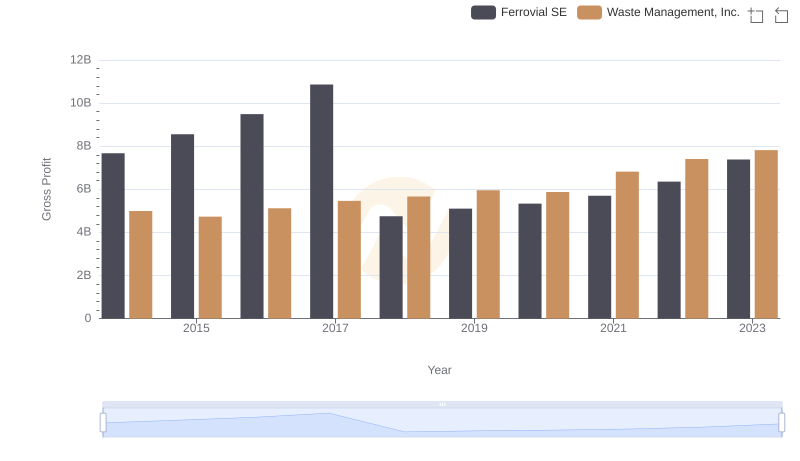
Key Insights on Gross Profit: Waste Management, Inc. vs Ferrovial SE
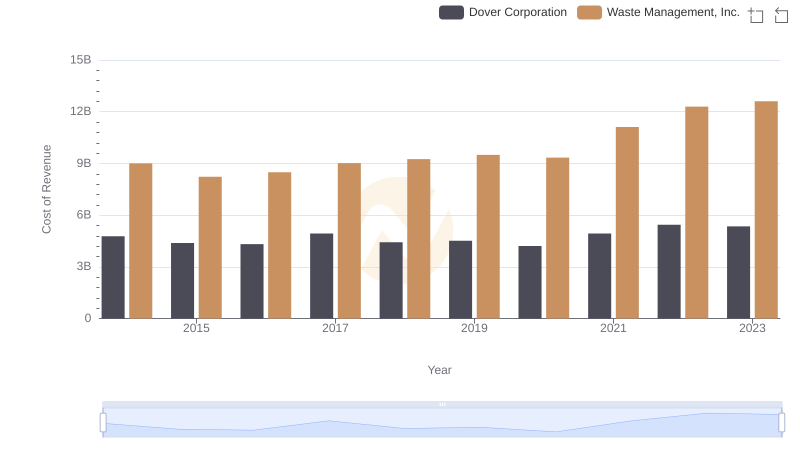
Comparing Cost of Revenue Efficiency: Waste Management, Inc. vs Dover Corporation

Waste Management, Inc. and Global Payments Inc.: A Detailed Gross Profit Analysis
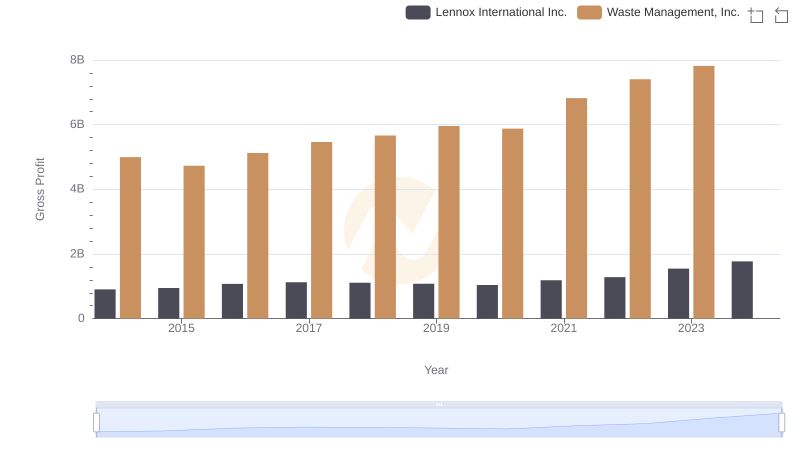
Gross Profit Comparison: Waste Management, Inc. and Lennox International Inc. Trends
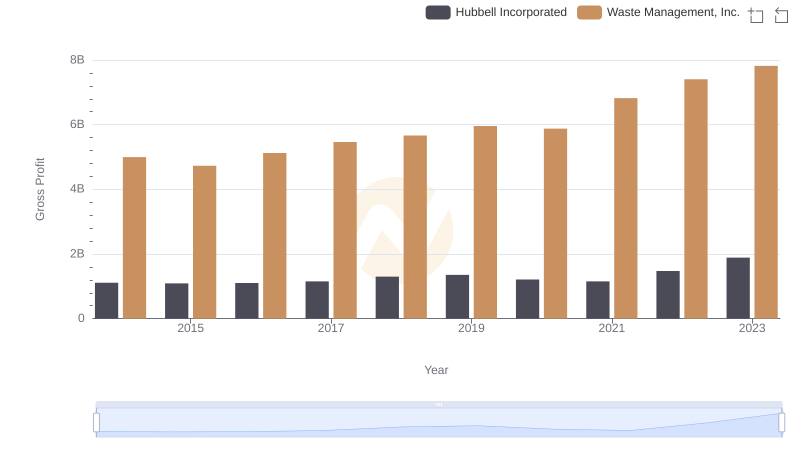
Waste Management, Inc. vs Hubbell Incorporated: A Gross Profit Performance Breakdown
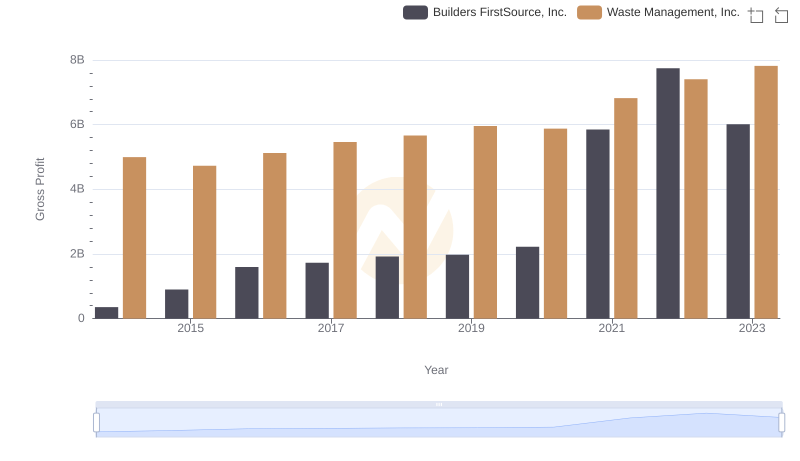
Gross Profit Comparison: Waste Management, Inc. and Builders FirstSource, Inc. Trends
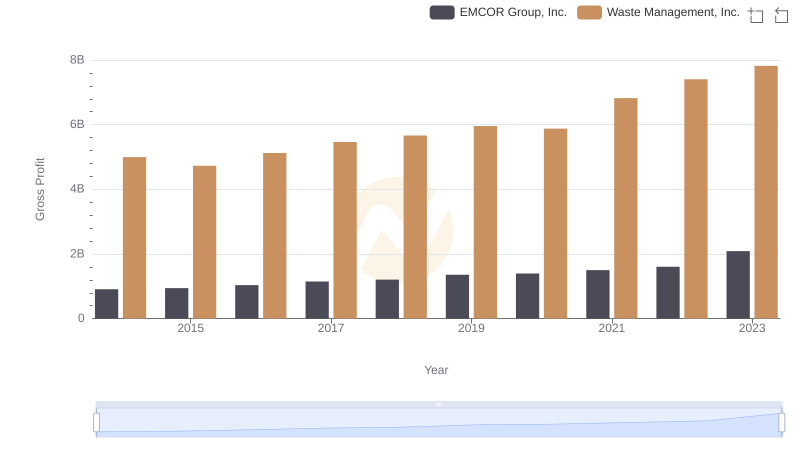
Gross Profit Analysis: Comparing Waste Management, Inc. and EMCOR Group, Inc.
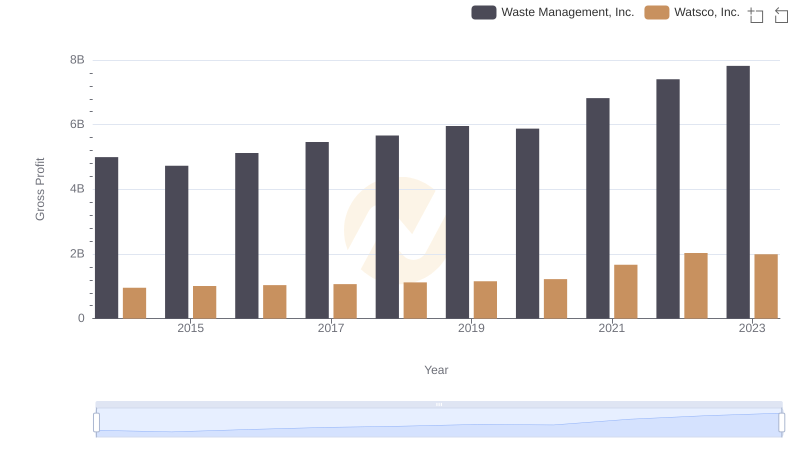
Who Generates Higher Gross Profit? Waste Management, Inc. or Watsco, Inc.
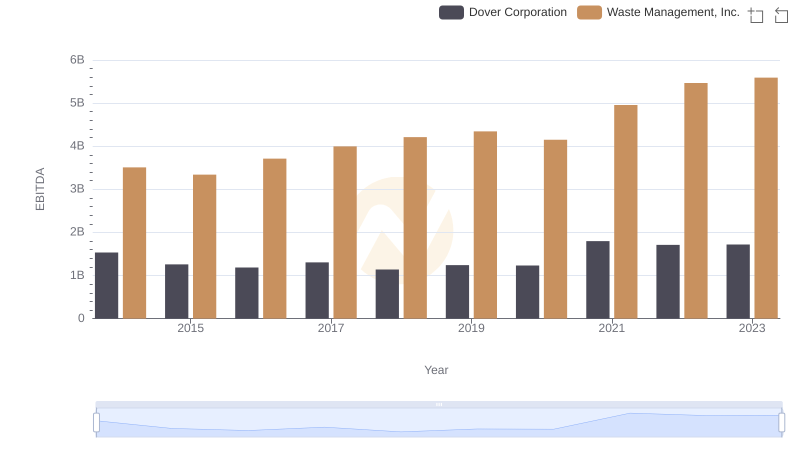
EBITDA Performance Review: Waste Management, Inc. vs Dover Corporation