| __timestamp | Builders FirstSource, Inc. | Waste Management, Inc. |
|---|---|---|
| Wednesday, January 1, 2014 | 356997000 | 4994000000 |
| Thursday, January 1, 2015 | 901458000 | 4730000000 |
| Friday, January 1, 2016 | 1596748000 | 5123000000 |
| Sunday, January 1, 2017 | 1727391000 | 5464000000 |
| Monday, January 1, 2018 | 1922940000 | 5665000000 |
| Tuesday, January 1, 2019 | 1976829000 | 5959000000 |
| Wednesday, January 1, 2020 | 2222584000 | 5877000000 |
| Friday, January 1, 2021 | 5850956000 | 6820000000 |
| Saturday, January 1, 2022 | 7744379000 | 7404000000 |
| Sunday, January 1, 2023 | 6012334000 | 7820000000 |
| Monday, January 1, 2024 | 8680000000 |
Cracking the code
In the ever-evolving landscape of American industry, Waste Management, Inc. and Builders FirstSource, Inc. have emerged as titans in their respective fields. Over the past decade, these companies have demonstrated remarkable growth in gross profit, reflecting their strategic prowess and market adaptability.
From 2014 to 2023, Waste Management's gross profit surged by approximately 57%, peaking in 2023. This growth underscores the company's robust waste management solutions and its commitment to sustainability. Meanwhile, Builders FirstSource experienced an astounding 1,585% increase in gross profit, highlighting its dominance in the construction supply sector, especially during the post-pandemic building boom.
While Waste Management consistently maintained higher profits, Builders FirstSource's rapid growth trajectory is a testament to its aggressive expansion and market capture strategies. As these industry leaders continue to innovate, their financial trajectories offer valuable insights into the broader economic trends shaping the U.S. market.
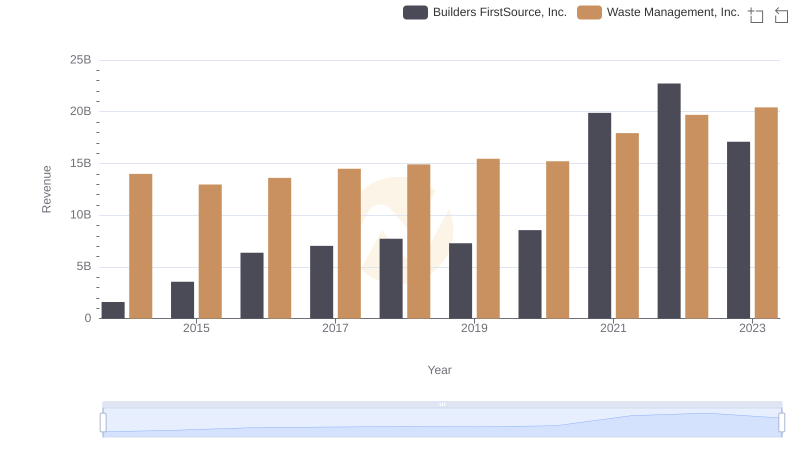
Breaking Down Revenue Trends: Waste Management, Inc. vs Builders FirstSource, Inc.

Waste Management, Inc. and Global Payments Inc.: A Detailed Gross Profit Analysis
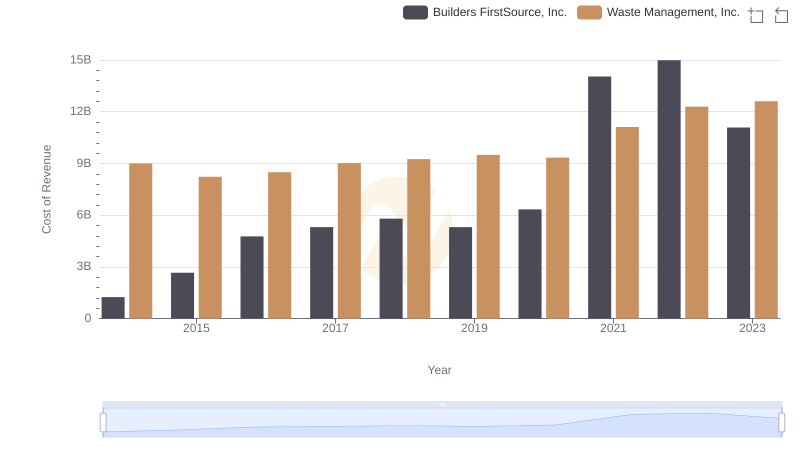
Cost Insights: Breaking Down Waste Management, Inc. and Builders FirstSource, Inc.'s Expenses
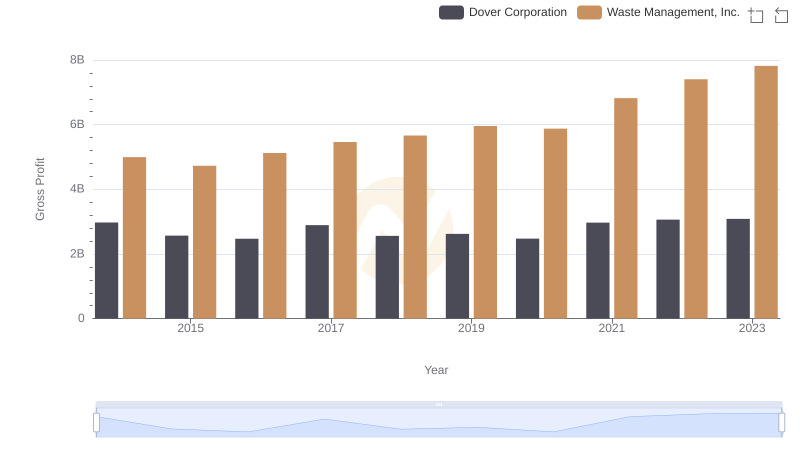
Waste Management, Inc. and Dover Corporation: A Detailed Gross Profit Analysis
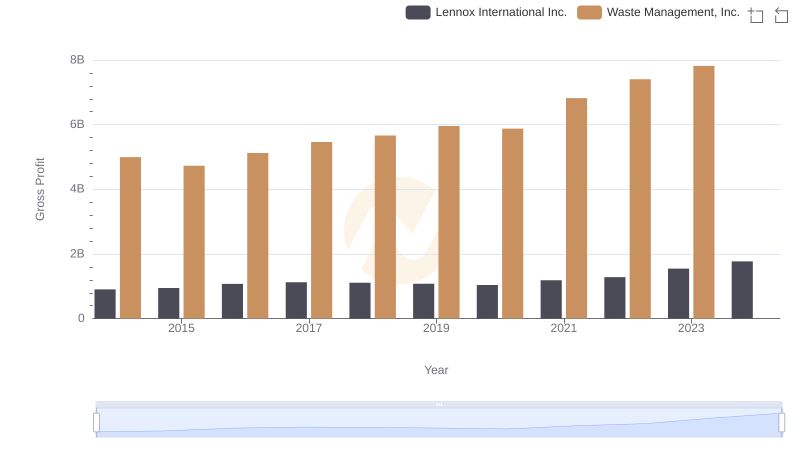
Gross Profit Comparison: Waste Management, Inc. and Lennox International Inc. Trends
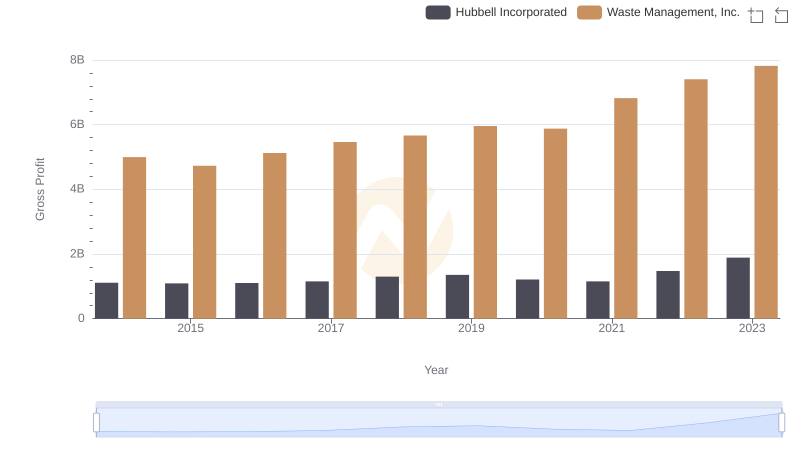
Waste Management, Inc. vs Hubbell Incorporated: A Gross Profit Performance Breakdown
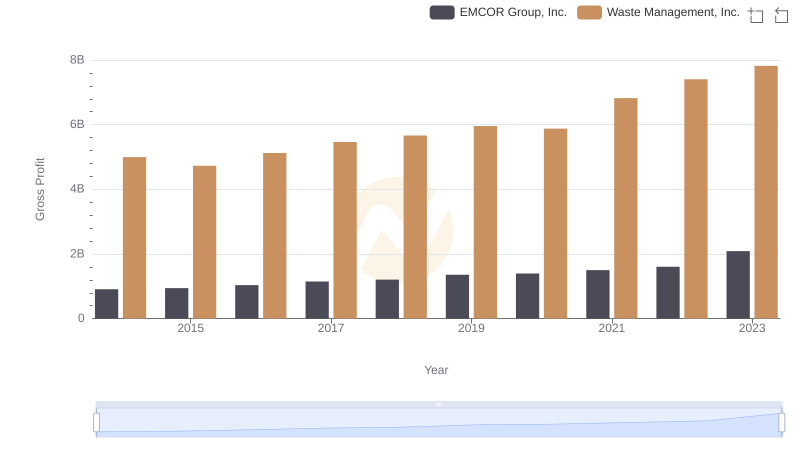
Gross Profit Analysis: Comparing Waste Management, Inc. and EMCOR Group, Inc.
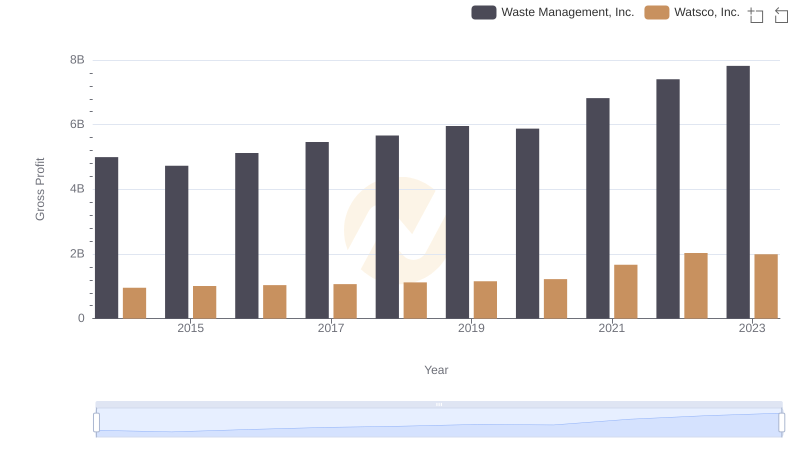
Who Generates Higher Gross Profit? Waste Management, Inc. or Watsco, Inc.
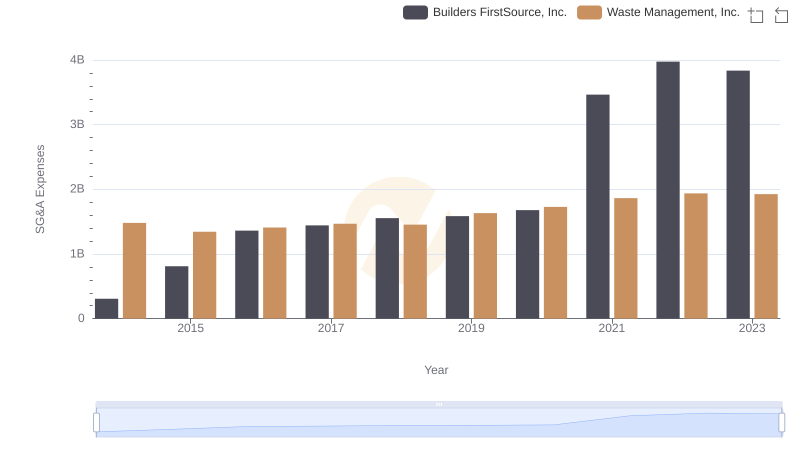
Who Optimizes SG&A Costs Better? Waste Management, Inc. or Builders FirstSource, Inc.
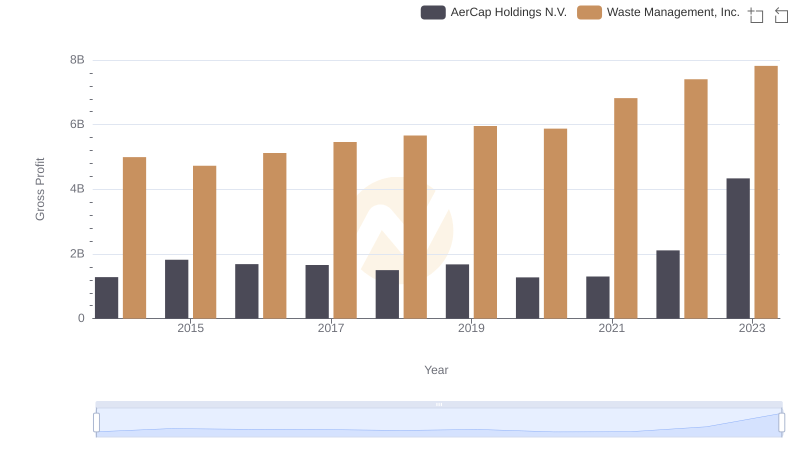
Gross Profit Analysis: Comparing Waste Management, Inc. and AerCap Holdings N.V.
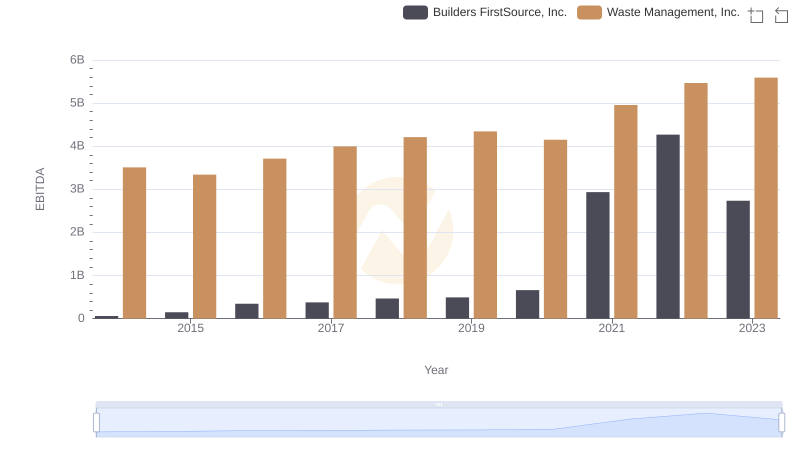
EBITDA Performance Review: Waste Management, Inc. vs Builders FirstSource, Inc.