| __timestamp | Rockwell Automation, Inc. | Waste Management, Inc. |
|---|---|---|
| Wednesday, January 1, 2014 | 2753900000 | 4994000000 |
| Thursday, January 1, 2015 | 2703100000 | 4730000000 |
| Friday, January 1, 2016 | 2475500000 | 5123000000 |
| Sunday, January 1, 2017 | 2624200000 | 5464000000 |
| Monday, January 1, 2018 | 2872200000 | 5665000000 |
| Tuesday, January 1, 2019 | 2900100000 | 5959000000 |
| Wednesday, January 1, 2020 | 2595200000 | 5877000000 |
| Friday, January 1, 2021 | 2897700000 | 6820000000 |
| Saturday, January 1, 2022 | 3102000000 | 7404000000 |
| Sunday, January 1, 2023 | 3717000000 | 7820000000 |
| Monday, January 1, 2024 | 3193400000 | 8680000000 |
Data in motion
In the ever-evolving landscape of industrial giants, Waste Management, Inc. and Rockwell Automation, Inc. have showcased intriguing financial trajectories over the past decade. From 2014 to 2023, Waste Management's gross profit surged by approximately 57%, peaking in 2023. This growth reflects the company's strategic expansions and increased demand for sustainable waste solutions. In contrast, Rockwell Automation experienced a more modest growth of around 16% during the same period, with a notable peak in 2023. This indicates a steady, albeit slower, adaptation to the increasing automation demands in manufacturing. Interestingly, 2024 data for Waste Management remains elusive, leaving room for speculation on its future performance. As these companies navigate the complexities of their respective industries, their financial trends offer valuable insights into their strategic directions and market responses.
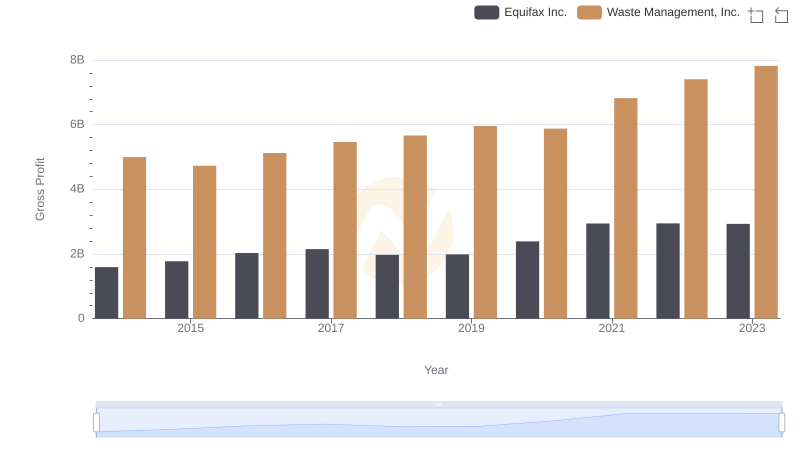
Gross Profit Trends Compared: Waste Management, Inc. vs Equifax Inc.
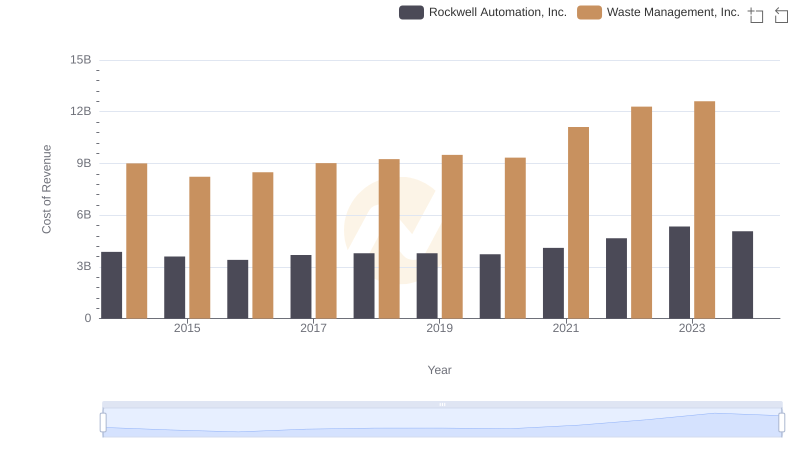
Cost of Revenue: Key Insights for Waste Management, Inc. and Rockwell Automation, Inc.
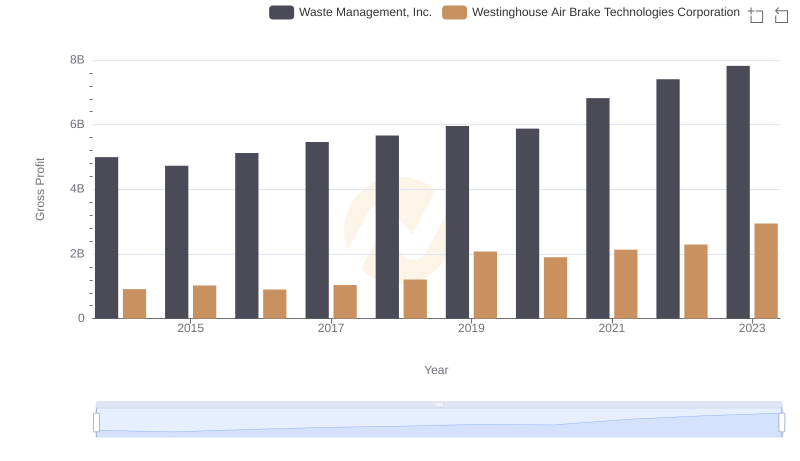
Who Generates Higher Gross Profit? Waste Management, Inc. or Westinghouse Air Brake Technologies Corporation
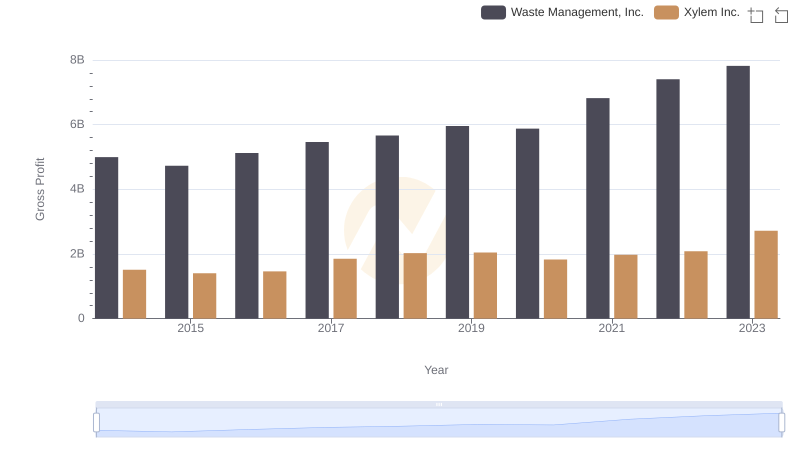
Gross Profit Trends Compared: Waste Management, Inc. vs Xylem Inc.
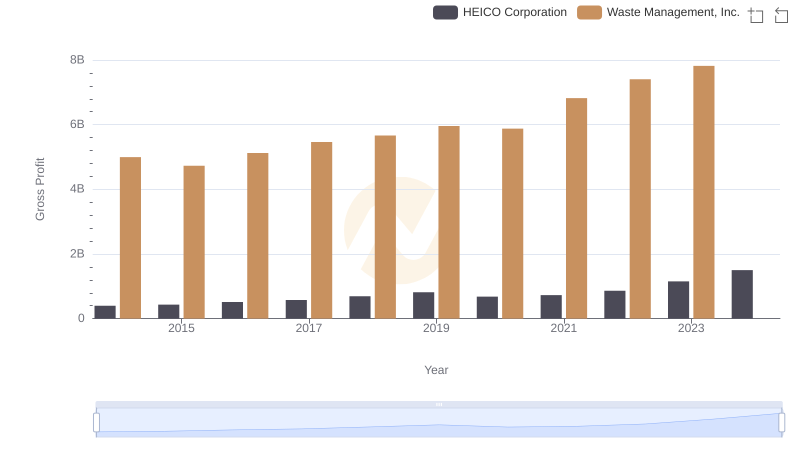
Gross Profit Analysis: Comparing Waste Management, Inc. and HEICO Corporation
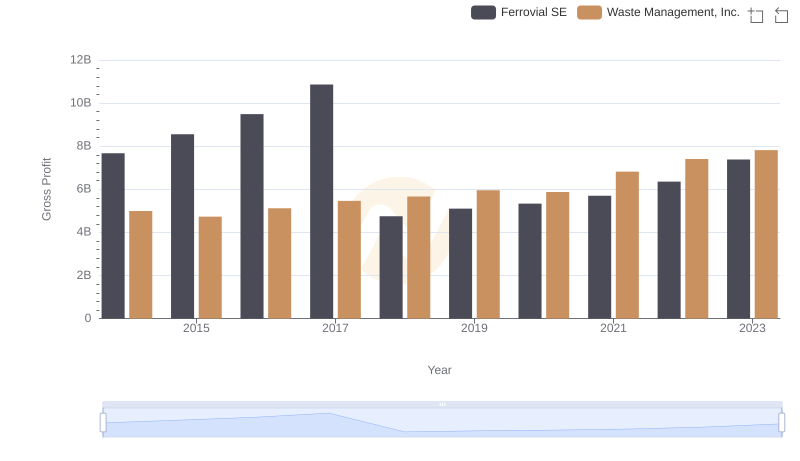
Key Insights on Gross Profit: Waste Management, Inc. vs Ferrovial SE

Waste Management, Inc. and Global Payments Inc.: A Detailed Gross Profit Analysis
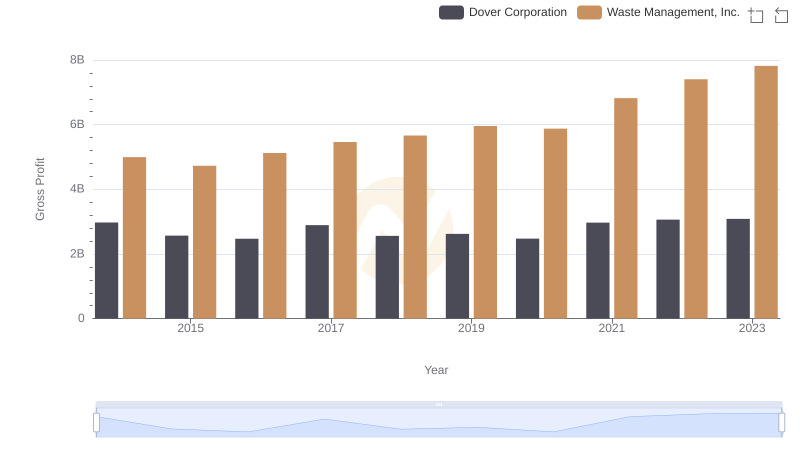
Waste Management, Inc. and Dover Corporation: A Detailed Gross Profit Analysis
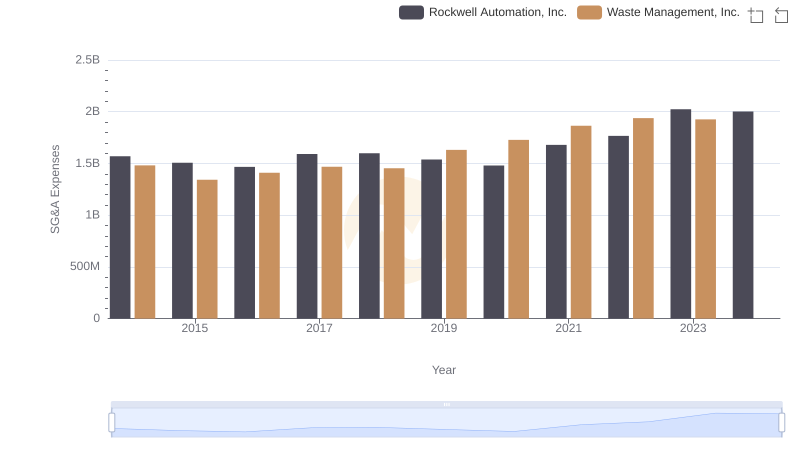
Cost Management Insights: SG&A Expenses for Waste Management, Inc. and Rockwell Automation, Inc.
Gross Profit Comparison: Waste Management, Inc. and Lennox International Inc. Trends