| __timestamp | Global Payments Inc. | Waste Management, Inc. |
|---|---|---|
| Wednesday, January 1, 2014 | 594102000 | 3509000000 |
| Thursday, January 1, 2015 | 618109000 | 3342000000 |
| Friday, January 1, 2016 | 748136000 | 3713000000 |
| Sunday, January 1, 2017 | 1010019000 | 3996000000 |
| Monday, January 1, 2018 | 1315968000 | 4212000000 |
| Tuesday, January 1, 2019 | 1764994000 | 4344000000 |
| Wednesday, January 1, 2020 | 2508393000 | 4149000000 |
| Friday, January 1, 2021 | 3233589000 | 4956000000 |
| Saturday, January 1, 2022 | 2427684000 | 5466000000 |
| Sunday, January 1, 2023 | 3606789000 | 5592000000 |
| Monday, January 1, 2024 | 2333605000 | 5128000000 |
Infusing magic into the data realm
In the ever-evolving landscape of corporate finance, EBITDA serves as a crucial metric for evaluating a company's operational performance. Over the past decade, Waste Management, Inc. and Global Payments Inc. have demonstrated contrasting trajectories in their EBITDA growth. From 2014 to 2023, Waste Management's EBITDA surged by approximately 60%, peaking at $5.6 billion in 2023. This growth underscores the company's robust operational efficiency and strategic market positioning.
Conversely, Global Payments Inc. experienced a more volatile journey, with EBITDA increasing by over 500% during the same period, reaching $3.7 billion in 2023. This dramatic rise reflects the company's aggressive expansion and adaptation to the digital payments revolution. Despite the fluctuations, both companies have shown resilience and adaptability, highlighting their pivotal roles in their respective industries. As we look to the future, these trends offer valuable insights into the financial health and strategic direction of these industry giants.
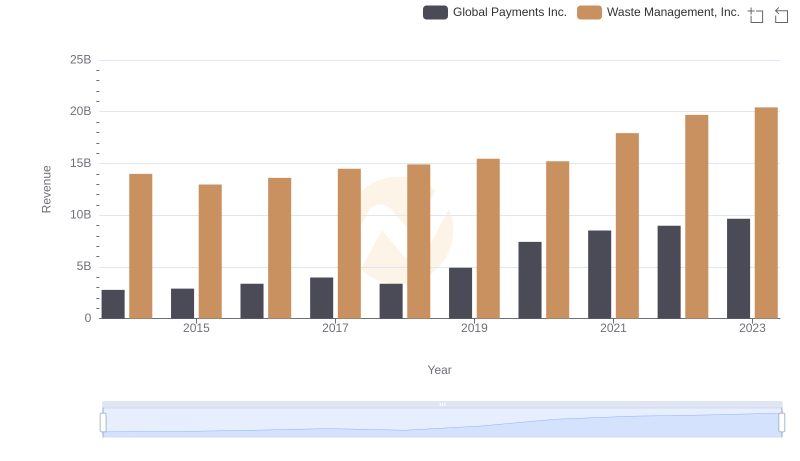
Revenue Showdown: Waste Management, Inc. vs Global Payments Inc.
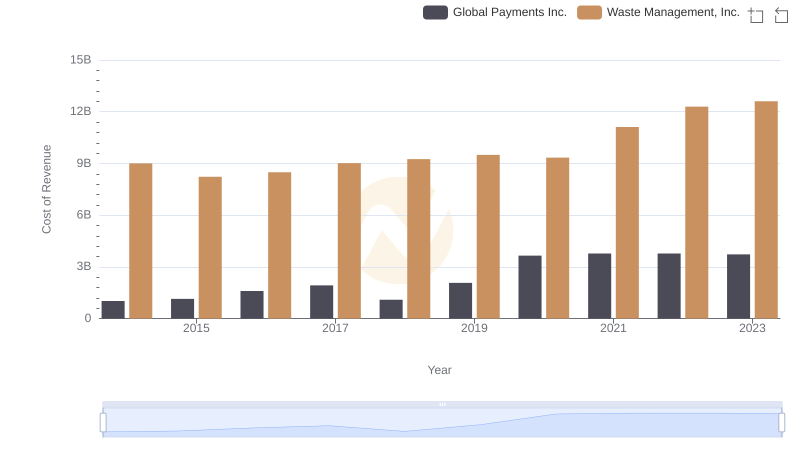
Cost of Revenue Trends: Waste Management, Inc. vs Global Payments Inc.

Waste Management, Inc. and Global Payments Inc.: A Detailed Gross Profit Analysis
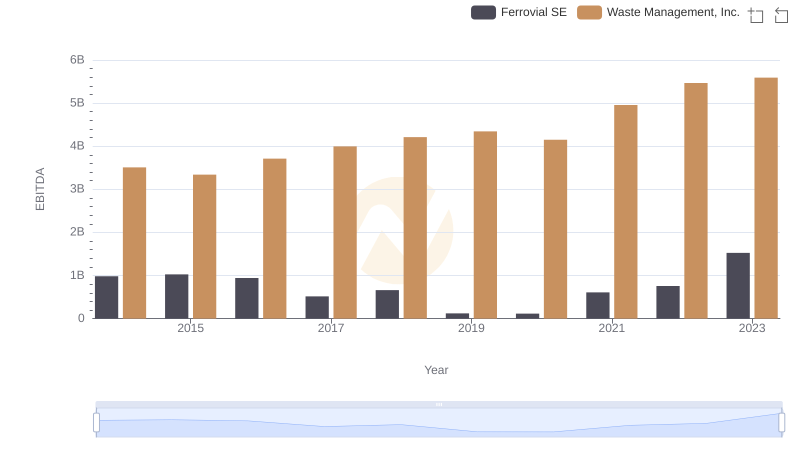
Waste Management, Inc. vs Ferrovial SE: In-Depth EBITDA Performance Comparison
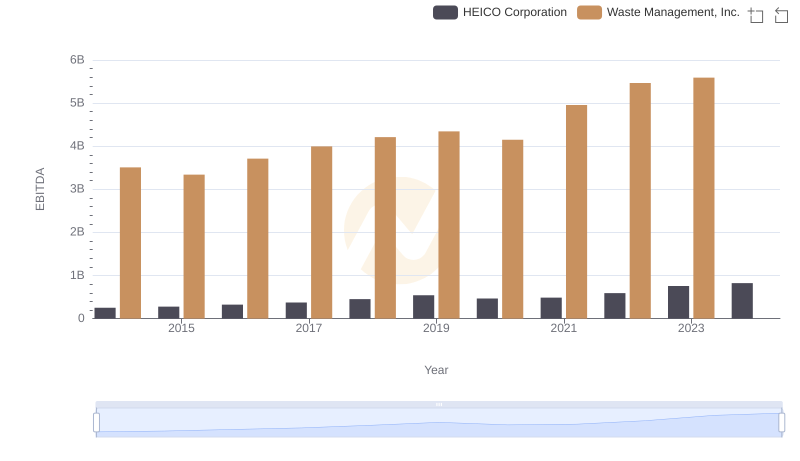
A Side-by-Side Analysis of EBITDA: Waste Management, Inc. and HEICO Corporation
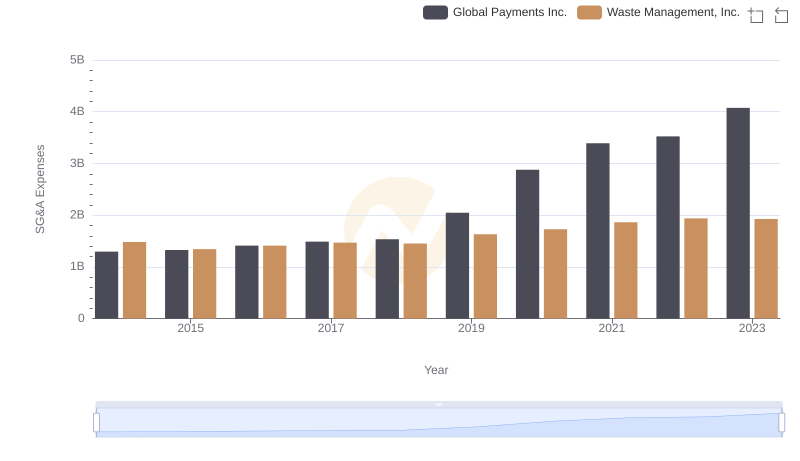
Waste Management, Inc. vs Global Payments Inc.: SG&A Expense Trends
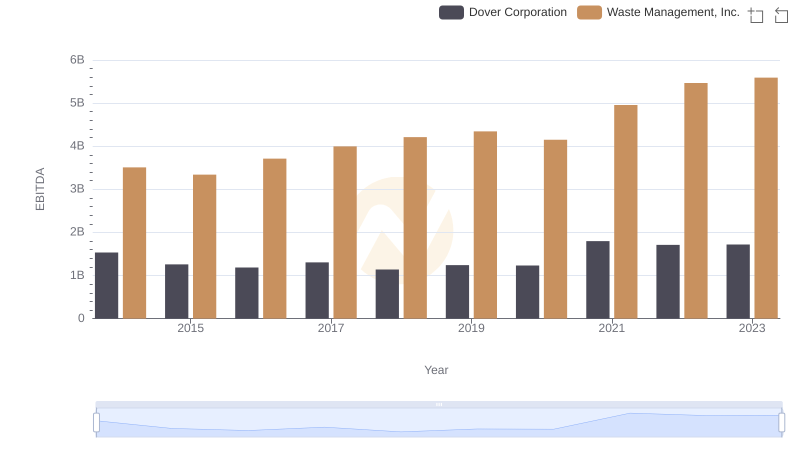
EBITDA Performance Review: Waste Management, Inc. vs Dover Corporation
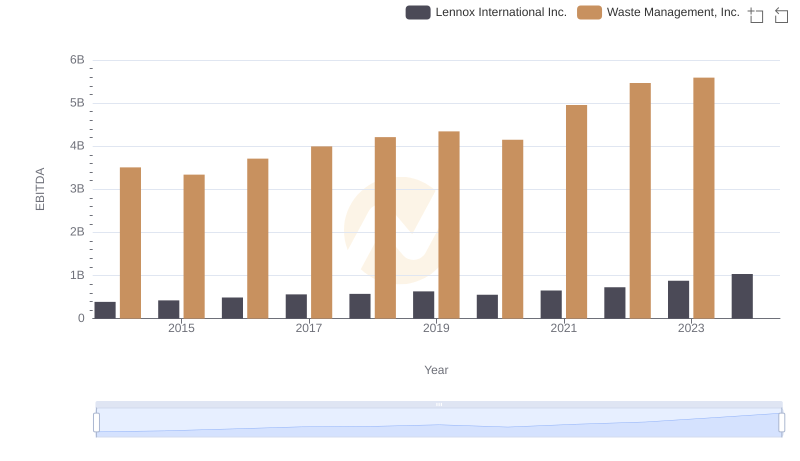
A Side-by-Side Analysis of EBITDA: Waste Management, Inc. and Lennox International Inc.
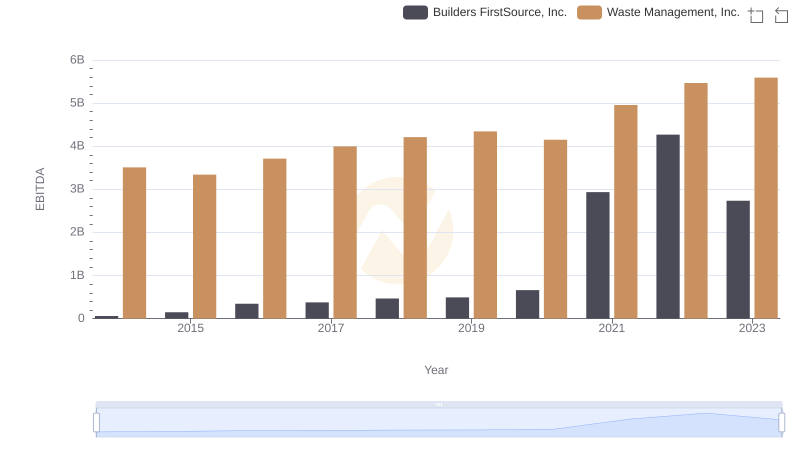
EBITDA Performance Review: Waste Management, Inc. vs Builders FirstSource, Inc.