| __timestamp | Ferrovial SE | Waste Management, Inc. |
|---|---|---|
| Wednesday, January 1, 2014 | 7671000000 | 4994000000 |
| Thursday, January 1, 2015 | 8556000000 | 4730000000 |
| Friday, January 1, 2016 | 9491000000 | 5123000000 |
| Sunday, January 1, 2017 | 10864000000 | 5464000000 |
| Monday, January 1, 2018 | 4752000000 | 5665000000 |
| Tuesday, January 1, 2019 | 5105000000 | 5959000000 |
| Wednesday, January 1, 2020 | 5336000000 | 5877000000 |
| Friday, January 1, 2021 | 5701000000 | 6820000000 |
| Saturday, January 1, 2022 | 6354000000 | 7404000000 |
| Sunday, January 1, 2023 | 7385000000 | 7820000000 |
| Monday, January 1, 2024 | 8680000000 |
Igniting the spark of knowledge
In the ever-evolving landscape of global waste management, two giants stand out: Waste Management, Inc. and Ferrovial SE. Over the past decade, these companies have showcased distinct trajectories in their gross profit margins. From 2014 to 2023, Ferrovial SE experienced a notable decline of approximately 4% in its gross profit, while Waste Management, Inc. saw a robust increase of around 57%. This divergence highlights the dynamic nature of the industry and the strategic adaptations each company has undertaken. Notably, Waste Management, Inc. surpassed Ferrovial SE in 2021, marking a pivotal shift in market leadership. As we delve deeper into these trends, it becomes evident that strategic investments and operational efficiencies have played crucial roles in shaping these outcomes. This analysis not only underscores the competitive spirit of the industry but also offers valuable insights for stakeholders and investors alike.
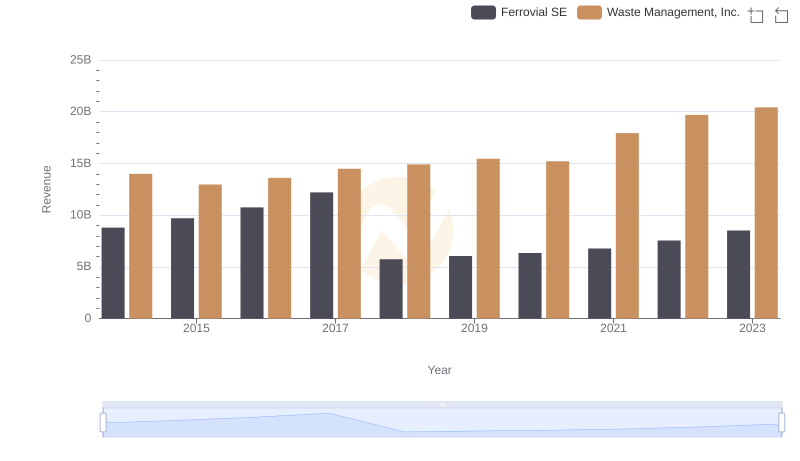
Waste Management, Inc. or Ferrovial SE: Who Leads in Yearly Revenue?
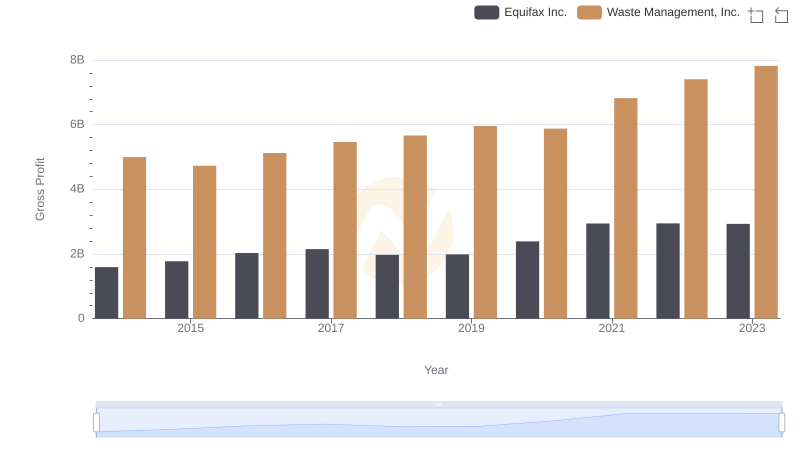
Gross Profit Trends Compared: Waste Management, Inc. vs Equifax Inc.
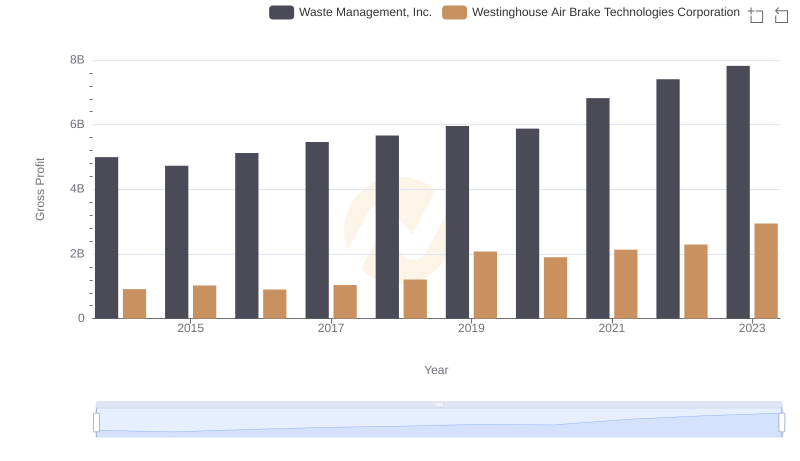
Who Generates Higher Gross Profit? Waste Management, Inc. or Westinghouse Air Brake Technologies Corporation
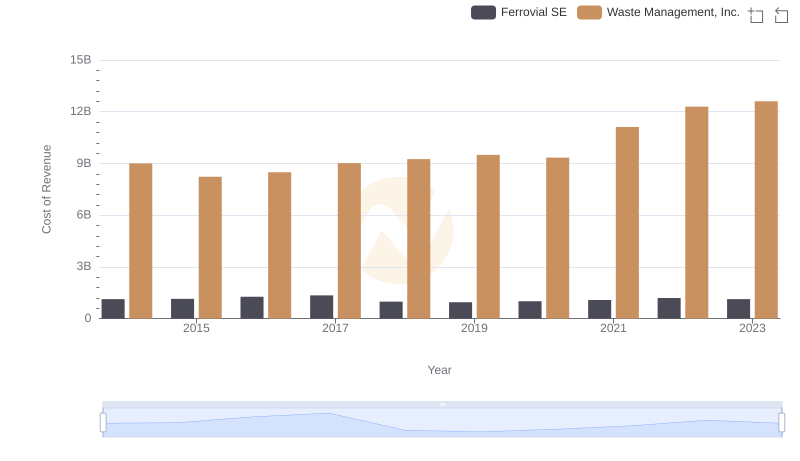
Cost of Revenue Comparison: Waste Management, Inc. vs Ferrovial SE
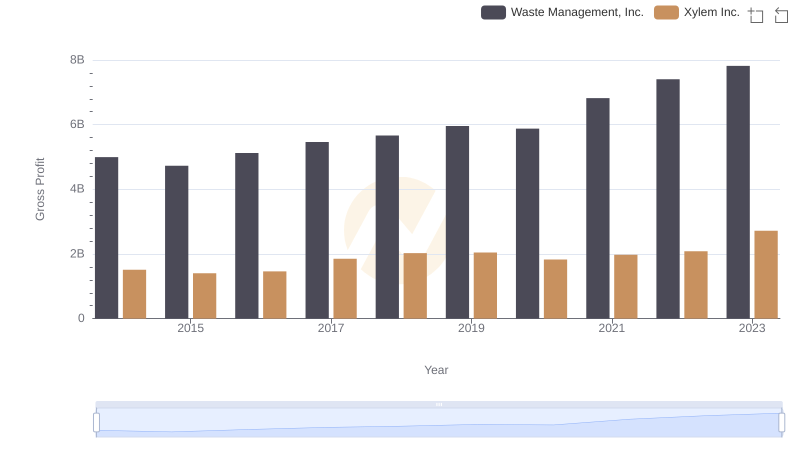
Gross Profit Trends Compared: Waste Management, Inc. vs Xylem Inc.
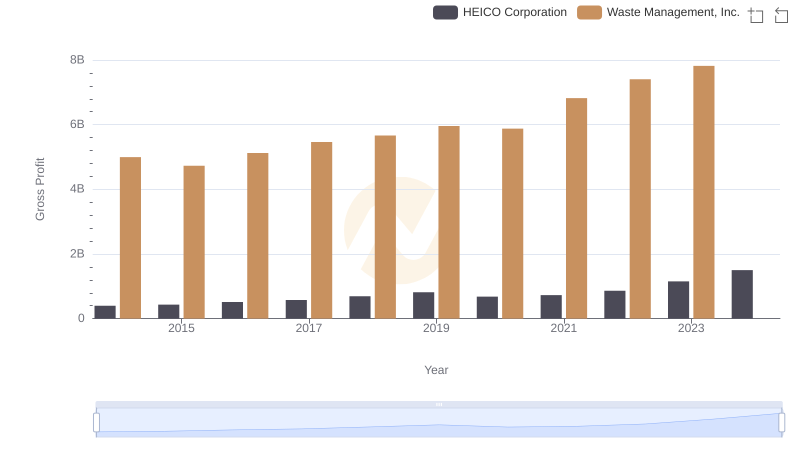
Gross Profit Analysis: Comparing Waste Management, Inc. and HEICO Corporation
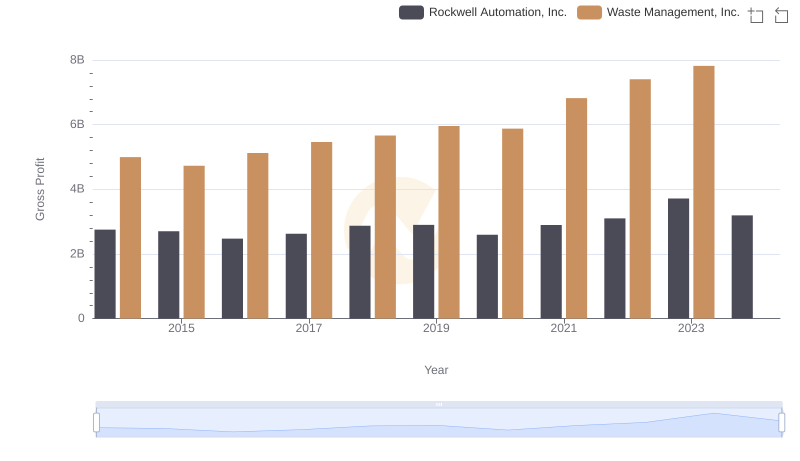
Gross Profit Comparison: Waste Management, Inc. and Rockwell Automation, Inc. Trends

Waste Management, Inc. and Global Payments Inc.: A Detailed Gross Profit Analysis
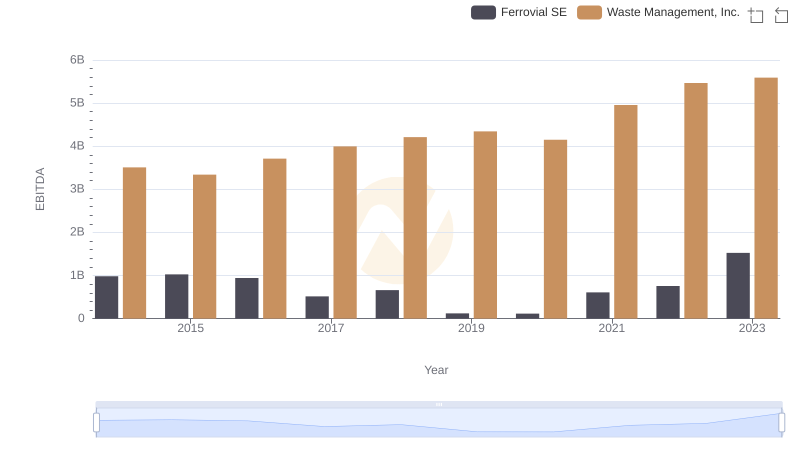
Waste Management, Inc. vs Ferrovial SE: In-Depth EBITDA Performance Comparison
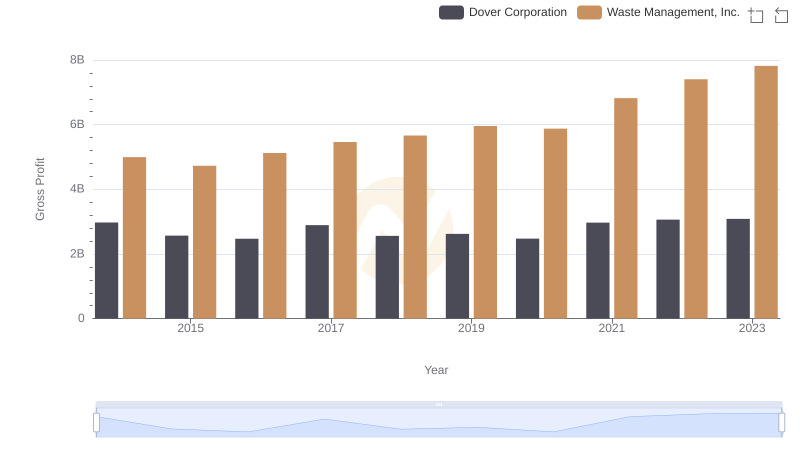
Waste Management, Inc. and Dover Corporation: A Detailed Gross Profit Analysis
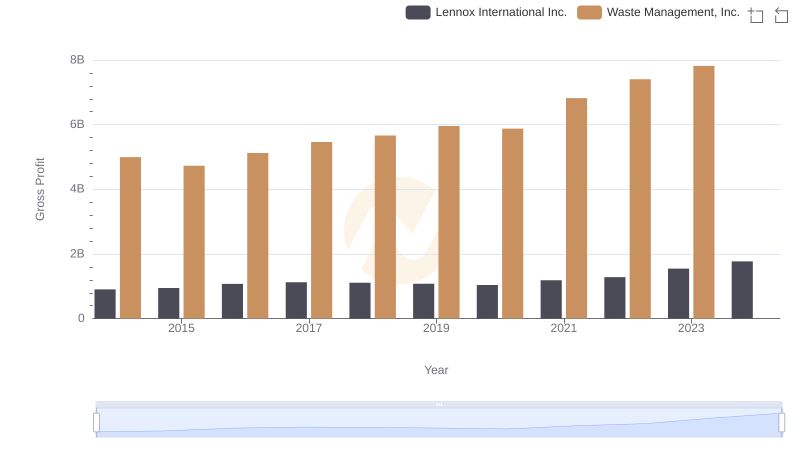
Gross Profit Comparison: Waste Management, Inc. and Lennox International Inc. Trends
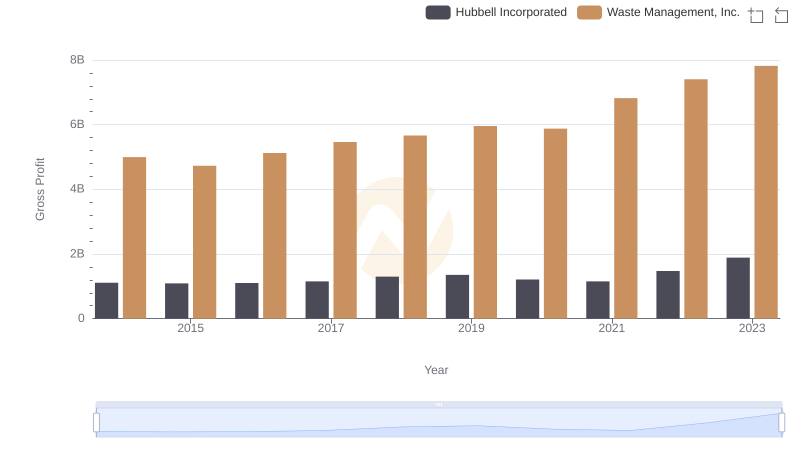
Waste Management, Inc. vs Hubbell Incorporated: A Gross Profit Performance Breakdown