| __timestamp | Hubbell Incorporated | Waste Management, Inc. |
|---|---|---|
| Wednesday, January 1, 2014 | 1109000000 | 4994000000 |
| Thursday, January 1, 2015 | 1091800000 | 4730000000 |
| Friday, January 1, 2016 | 1100700000 | 5123000000 |
| Sunday, January 1, 2017 | 1151900000 | 5464000000 |
| Monday, January 1, 2018 | 1300400000 | 5665000000 |
| Tuesday, January 1, 2019 | 1352700000 | 5959000000 |
| Wednesday, January 1, 2020 | 1209300000 | 5877000000 |
| Friday, January 1, 2021 | 1151500000 | 6820000000 |
| Saturday, January 1, 2022 | 1471600000 | 7404000000 |
| Sunday, January 1, 2023 | 1888100000 | 7820000000 |
| Monday, January 1, 2024 | 1904100000 | 8680000000 |
Infusing magic into the data realm
In the world of industrial giants, Waste Management, Inc. and Hubbell Incorporated have carved out significant niches. Over the past decade, Waste Management has consistently outperformed Hubbell in terms of gross profit, showcasing a robust growth trajectory. From 2014 to 2023, Waste Management's gross profit surged by approximately 57%, peaking at $7.82 billion in 2023. In contrast, Hubbell's growth, while steady, was more modest, with a 70% increase, reaching $1.89 billion in the same year.
This performance highlights Waste Management's dominance in the waste management sector, driven by strategic expansions and a focus on sustainability. Meanwhile, Hubbell's steady climb reflects its resilience and adaptability in the electrical and lighting industry. As these companies continue to evolve, their financial trajectories offer valuable insights into their strategic priorities and market positioning.
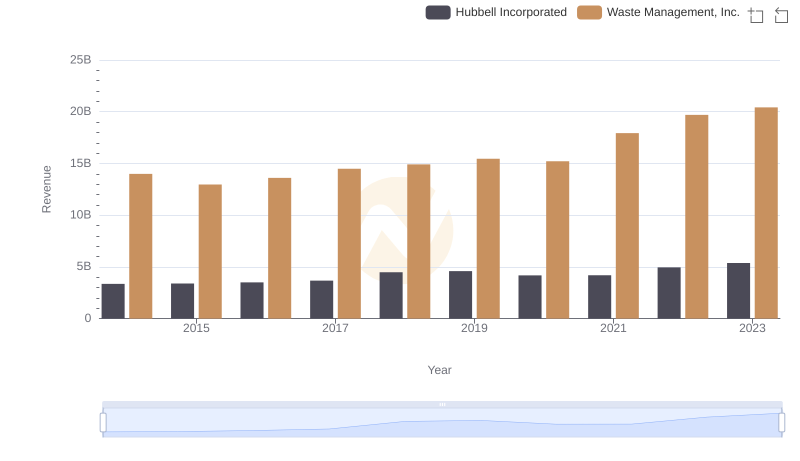
Waste Management, Inc. vs Hubbell Incorporated: Annual Revenue Growth Compared

Waste Management, Inc. and Global Payments Inc.: A Detailed Gross Profit Analysis
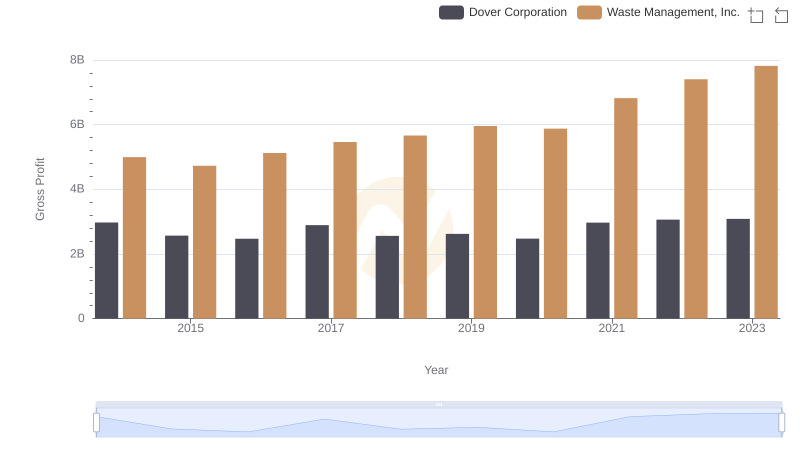
Waste Management, Inc. and Dover Corporation: A Detailed Gross Profit Analysis
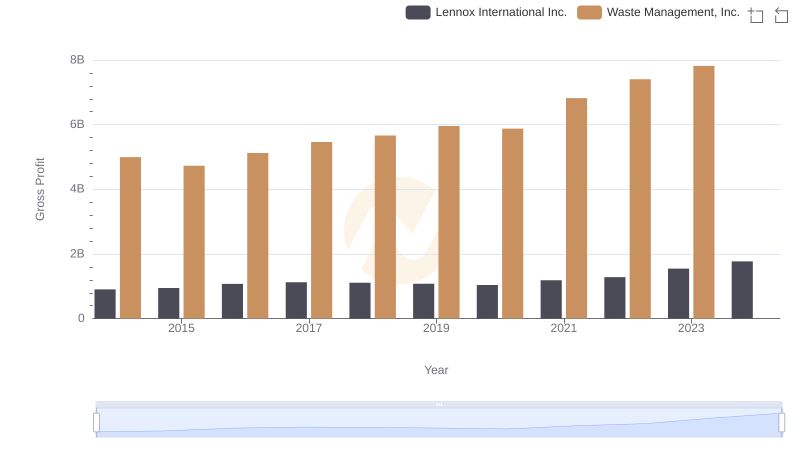
Gross Profit Comparison: Waste Management, Inc. and Lennox International Inc. Trends
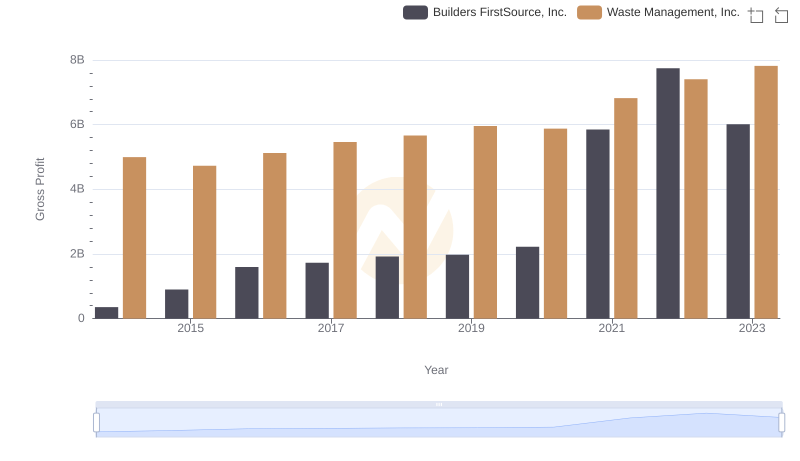
Gross Profit Comparison: Waste Management, Inc. and Builders FirstSource, Inc. Trends
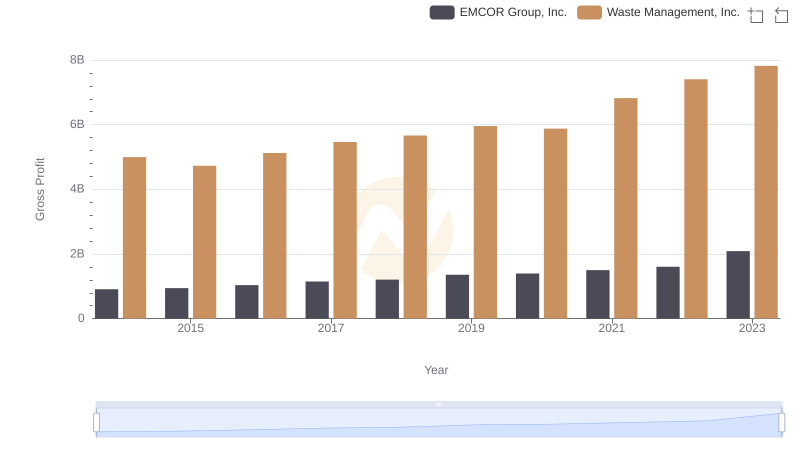
Gross Profit Analysis: Comparing Waste Management, Inc. and EMCOR Group, Inc.
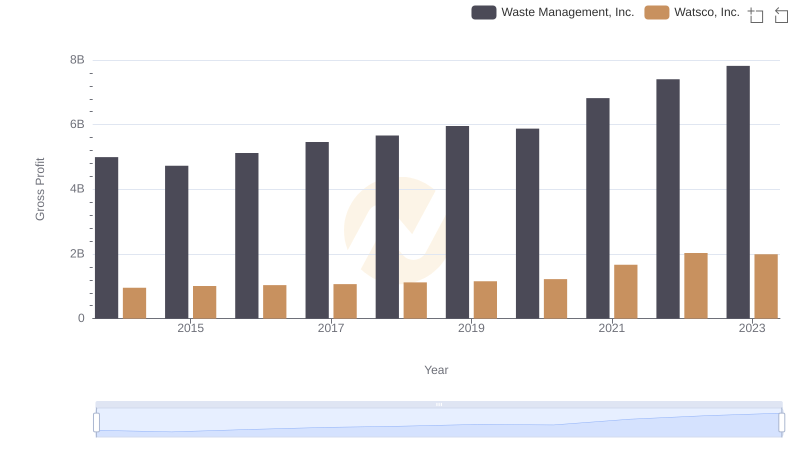
Who Generates Higher Gross Profit? Waste Management, Inc. or Watsco, Inc.
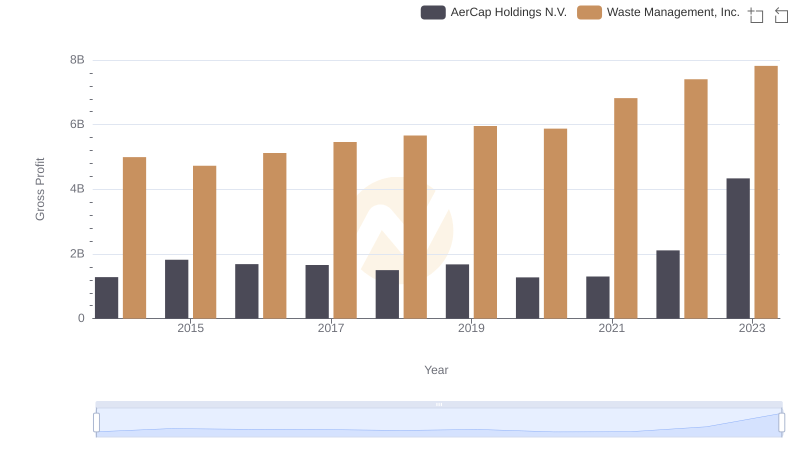
Gross Profit Analysis: Comparing Waste Management, Inc. and AerCap Holdings N.V.
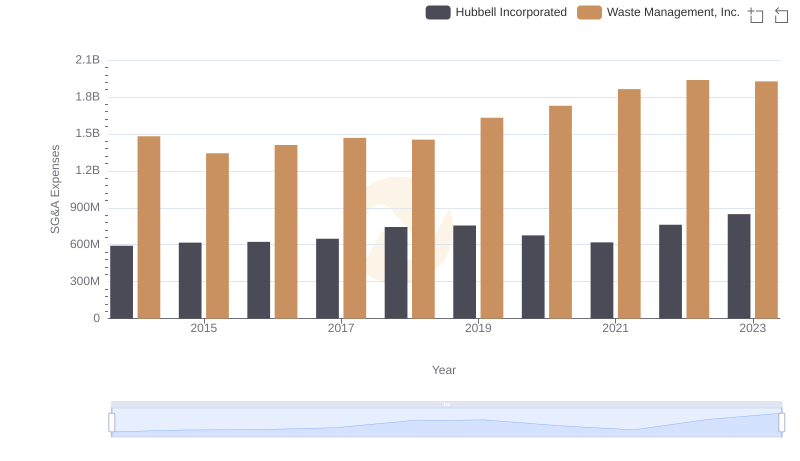
Waste Management, Inc. and Hubbell Incorporated: SG&A Spending Patterns Compared