| __timestamp | Global Payments Inc. | Waste Management, Inc. |
|---|---|---|
| Wednesday, January 1, 2014 | 1022107000 | 9002000000 |
| Thursday, January 1, 2015 | 1147639000 | 8231000000 |
| Friday, January 1, 2016 | 1603532000 | 8486000000 |
| Sunday, January 1, 2017 | 1928037000 | 9021000000 |
| Monday, January 1, 2018 | 1095014000 | 9249000000 |
| Tuesday, January 1, 2019 | 2073803000 | 9496000000 |
| Wednesday, January 1, 2020 | 3650727000 | 9341000000 |
| Friday, January 1, 2021 | 3773725000 | 11111000000 |
| Saturday, January 1, 2022 | 3778617000 | 12294000000 |
| Sunday, January 1, 2023 | 3727521000 | 12606000000 |
| Monday, January 1, 2024 | 3760116000 | 13383000000 |
Unveiling the hidden dimensions of data
In the ever-evolving landscape of corporate finance, understanding cost structures is crucial. Waste Management, Inc. and Global Payments Inc. offer a fascinating study in contrasts over the past decade. From 2014 to 2023, Waste Management's cost of revenue has consistently outpaced Global Payments, reflecting its capital-intensive operations. In 2023, Waste Management's cost of revenue reached approximately $12.6 billion, marking a 40% increase from 2014. Meanwhile, Global Payments saw a more dramatic rise, with costs nearly quadrupling to $3.7 billion in the same period. This divergence highlights the differing business models and market dynamics each company faces. Waste Management's steady growth underscores its resilience in a stable industry, while Global Payments' rapid increase reflects its expansion in the fast-paced digital payments sector. These trends offer valuable insights for investors and industry analysts alike.
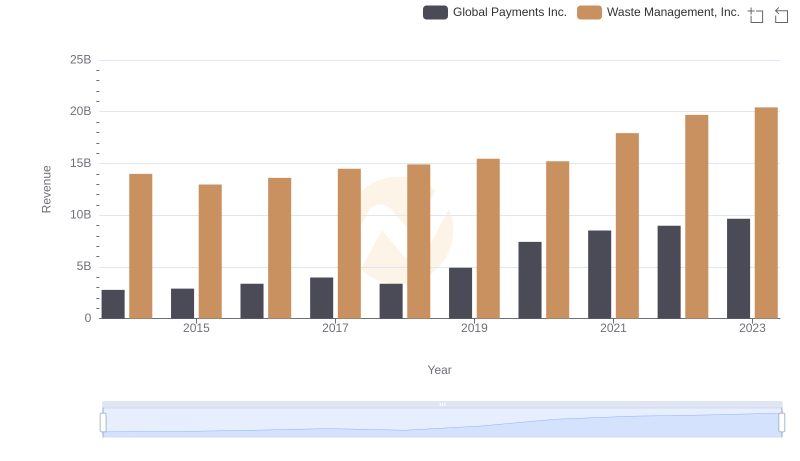
Revenue Showdown: Waste Management, Inc. vs Global Payments Inc.
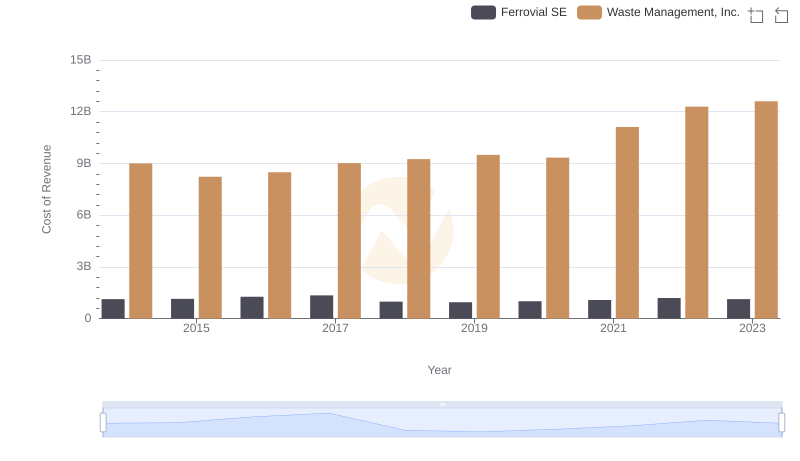
Cost of Revenue Comparison: Waste Management, Inc. vs Ferrovial SE
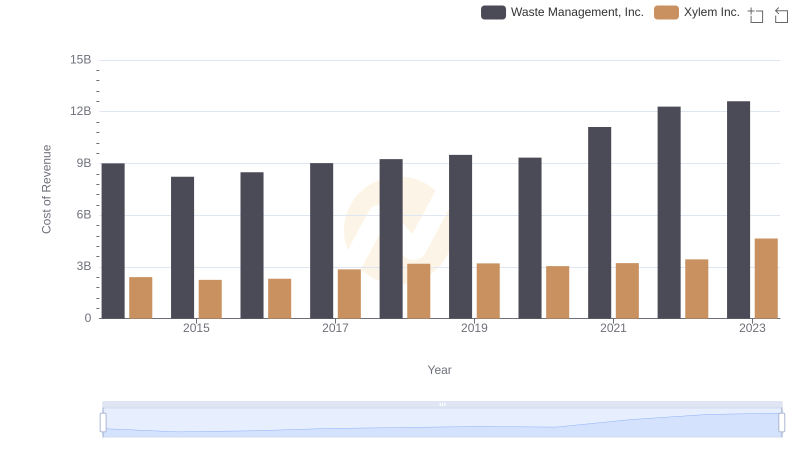
Cost of Revenue: Key Insights for Waste Management, Inc. and Xylem Inc.
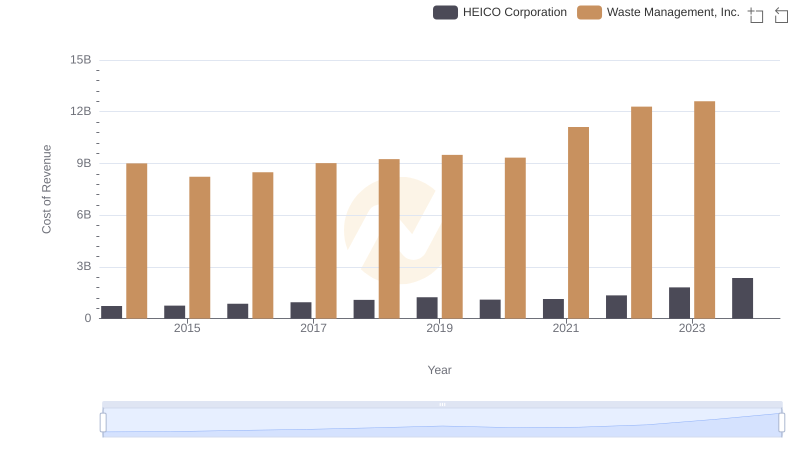
Comparing Cost of Revenue Efficiency: Waste Management, Inc. vs HEICO Corporation
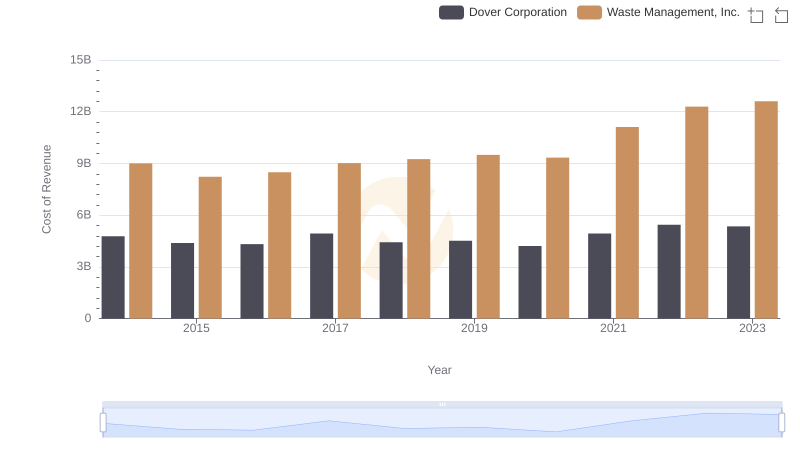
Comparing Cost of Revenue Efficiency: Waste Management, Inc. vs Dover Corporation
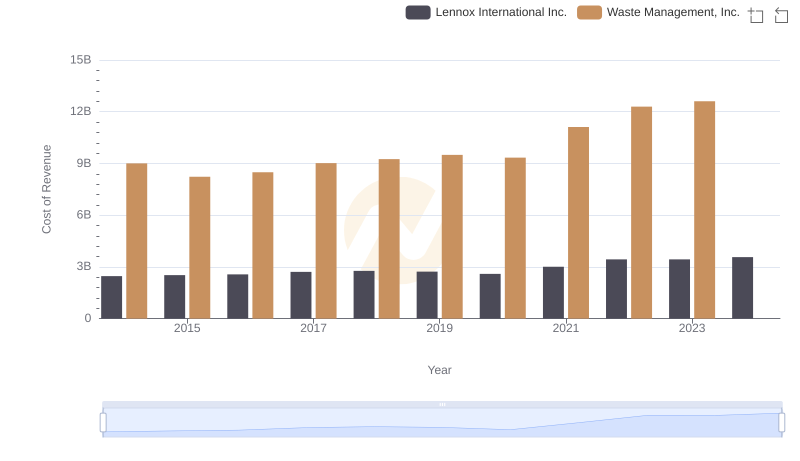
Cost Insights: Breaking Down Waste Management, Inc. and Lennox International Inc.'s Expenses

Waste Management, Inc. and Global Payments Inc.: A Detailed Gross Profit Analysis
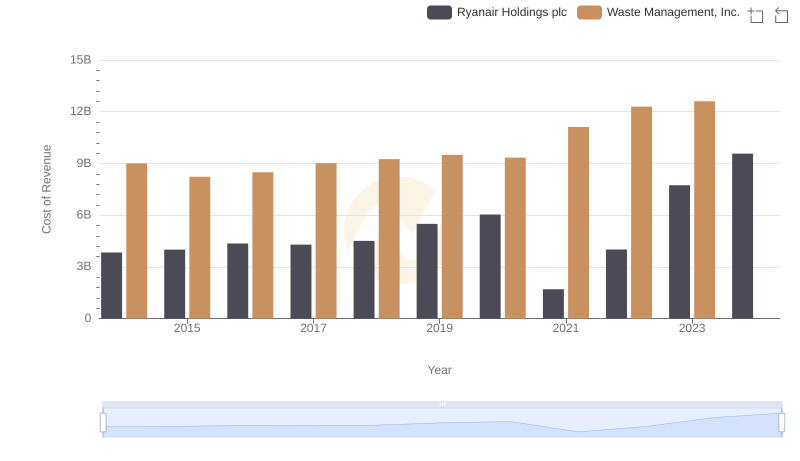
Cost Insights: Breaking Down Waste Management, Inc. and Ryanair Holdings plc's Expenses
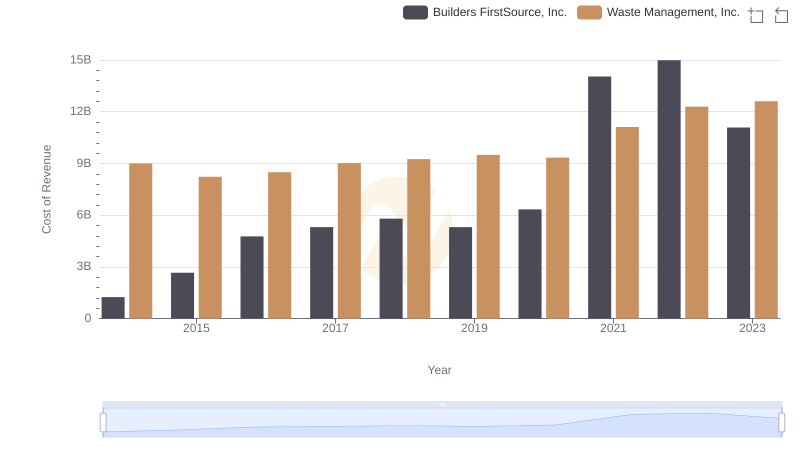
Cost Insights: Breaking Down Waste Management, Inc. and Builders FirstSource, Inc.'s Expenses
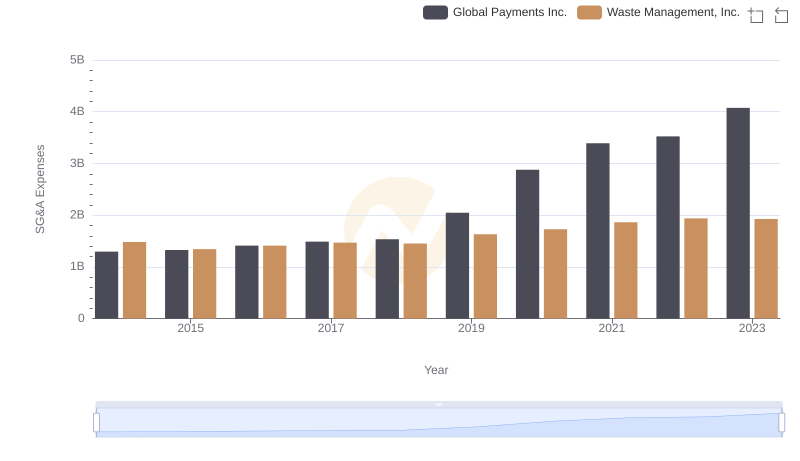
Waste Management, Inc. vs Global Payments Inc.: SG&A Expense Trends
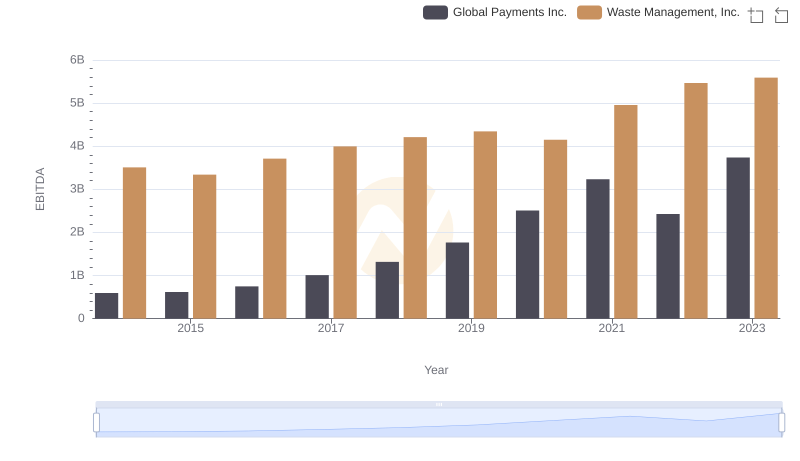
A Professional Review of EBITDA: Waste Management, Inc. Compared to Global Payments Inc.