| __timestamp | Lennox International Inc. | Waste Management, Inc. |
|---|---|---|
| Wednesday, January 1, 2014 | 903300000 | 4994000000 |
| Thursday, January 1, 2015 | 947400000 | 4730000000 |
| Friday, January 1, 2016 | 1076500000 | 5123000000 |
| Sunday, January 1, 2017 | 1125200000 | 5464000000 |
| Monday, January 1, 2018 | 1111200000 | 5665000000 |
| Tuesday, January 1, 2019 | 1079800000 | 5959000000 |
| Wednesday, January 1, 2020 | 1040100000 | 5877000000 |
| Friday, January 1, 2021 | 1188400000 | 6820000000 |
| Saturday, January 1, 2022 | 1284700000 | 7404000000 |
| Sunday, January 1, 2023 | 1547800000 | 7820000000 |
| Monday, January 1, 2024 | 1771900000 | 8680000000 |
Igniting the spark of knowledge
In the ever-evolving landscape of American industry, Waste Management, Inc. and Lennox International Inc. stand as titans in their respective fields. Over the past decade, Waste Management has consistently outperformed Lennox in terms of gross profit, showcasing a robust growth trajectory. From 2014 to 2023, Waste Management's gross profit surged by approximately 57%, peaking in 2023. In contrast, Lennox International, while experiencing a steady increase, saw a more modest growth of around 96% over the same period.
The data reveals a fascinating narrative of resilience and adaptation. Waste Management's dominance is evident, yet Lennox's upward trend highlights its potential. As we look to the future, the absence of 2024 data for Waste Management leaves room for speculation. Will Lennox close the gap, or will Waste Management continue its reign? Only time will tell.

Breaking Down Revenue Trends: Waste Management, Inc. vs Lennox International Inc.
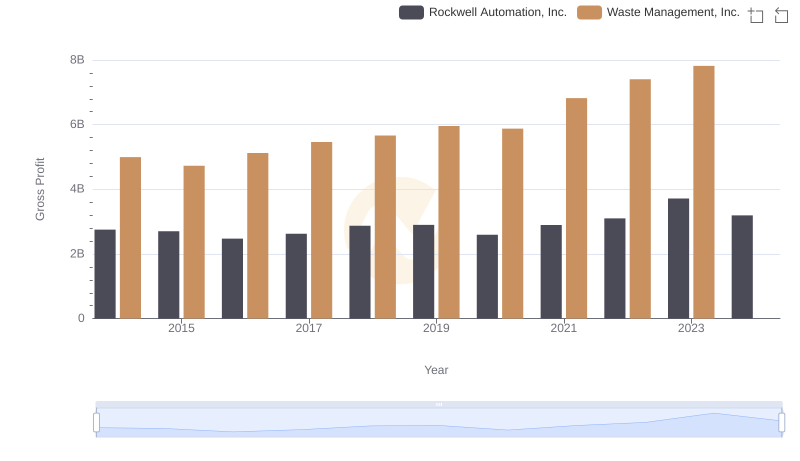
Gross Profit Comparison: Waste Management, Inc. and Rockwell Automation, Inc. Trends
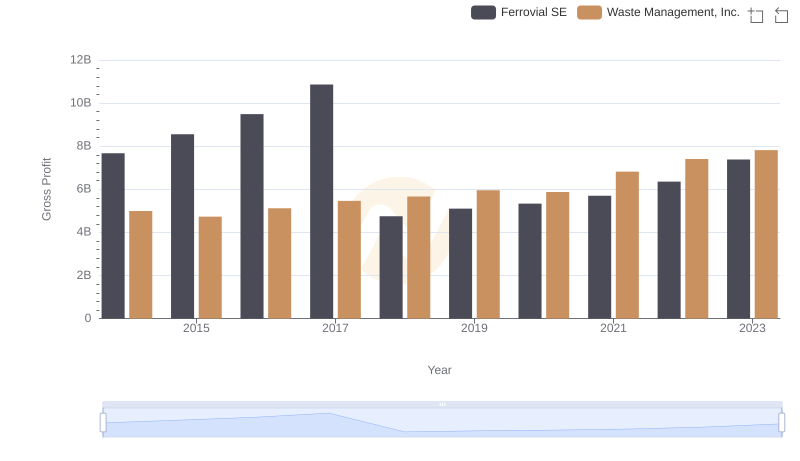
Key Insights on Gross Profit: Waste Management, Inc. vs Ferrovial SE
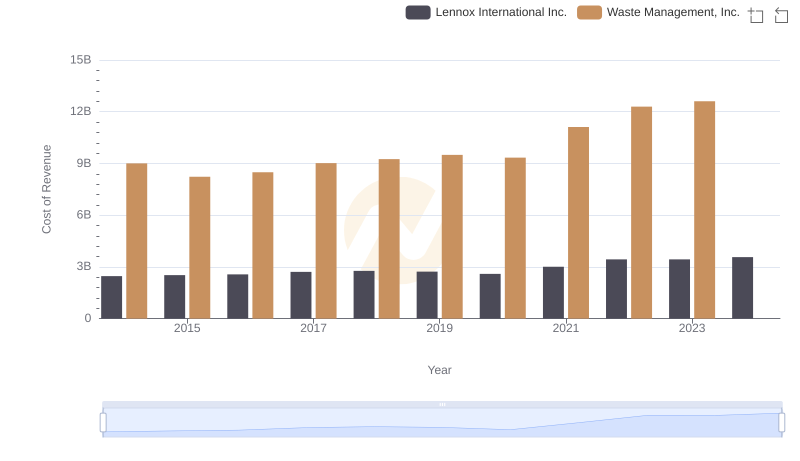
Cost Insights: Breaking Down Waste Management, Inc. and Lennox International Inc.'s Expenses

Waste Management, Inc. and Global Payments Inc.: A Detailed Gross Profit Analysis
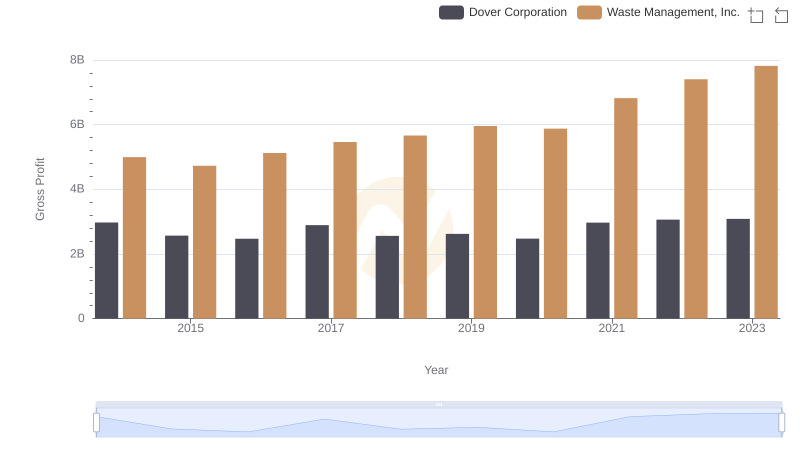
Waste Management, Inc. and Dover Corporation: A Detailed Gross Profit Analysis
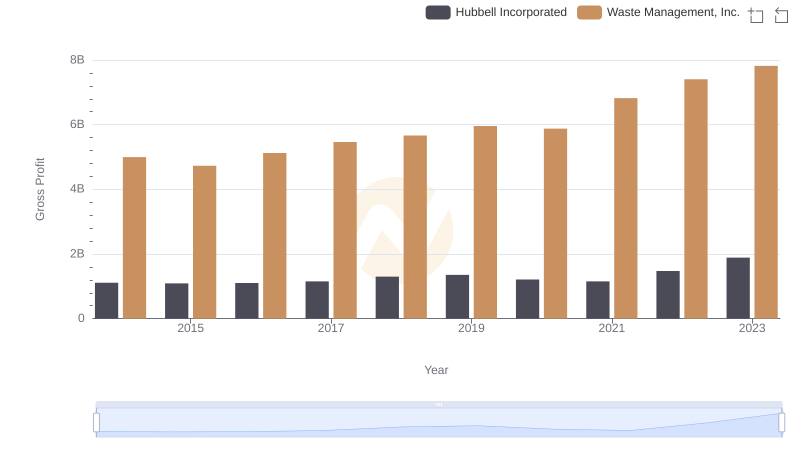
Waste Management, Inc. vs Hubbell Incorporated: A Gross Profit Performance Breakdown
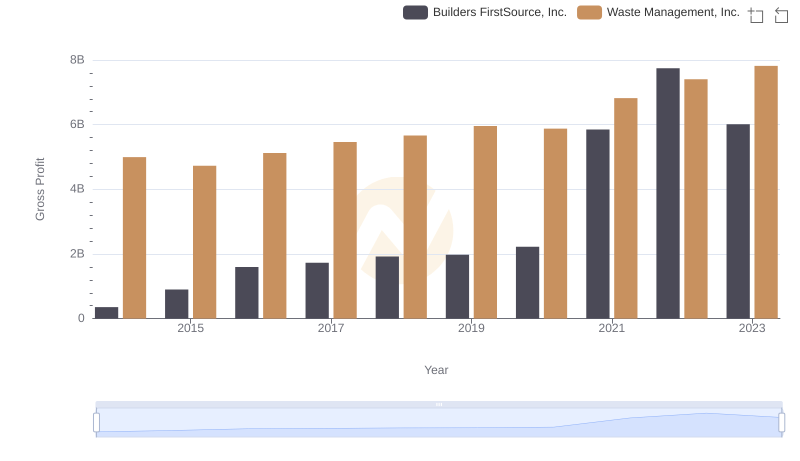
Gross Profit Comparison: Waste Management, Inc. and Builders FirstSource, Inc. Trends
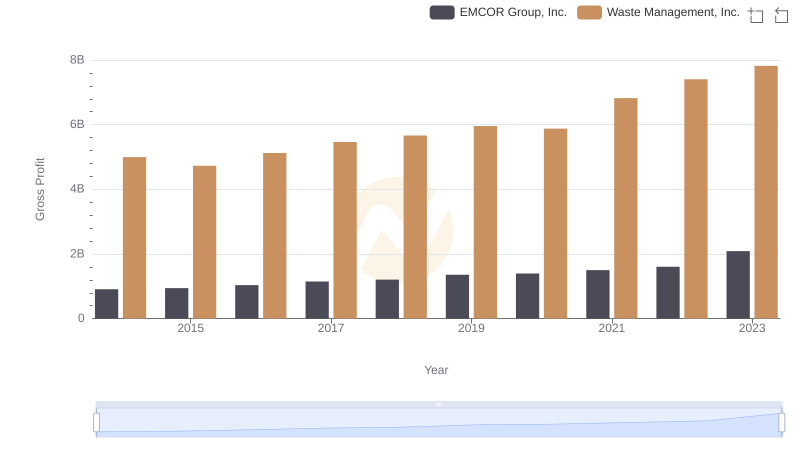
Gross Profit Analysis: Comparing Waste Management, Inc. and EMCOR Group, Inc.
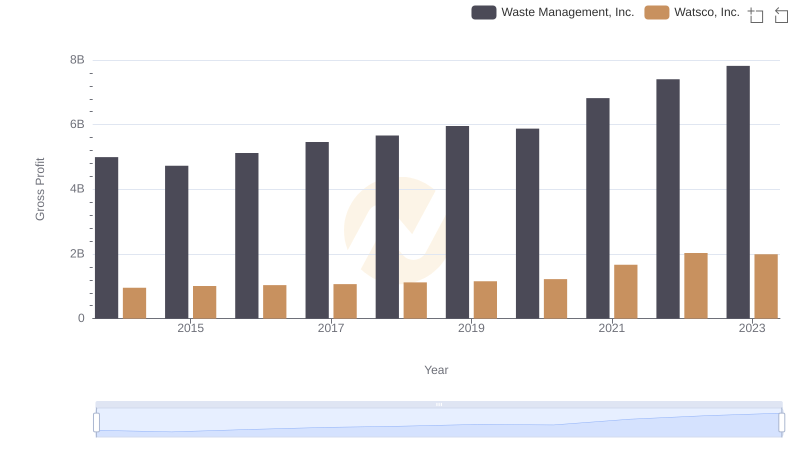
Who Generates Higher Gross Profit? Waste Management, Inc. or Watsco, Inc.
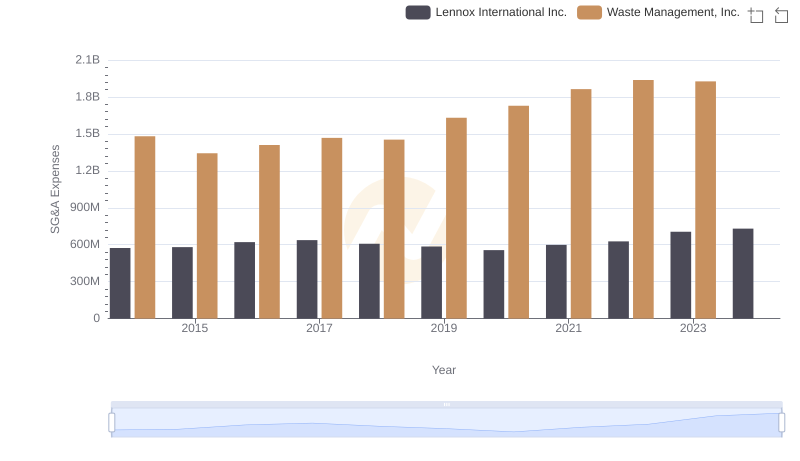
Waste Management, Inc. vs Lennox International Inc.: SG&A Expense Trends
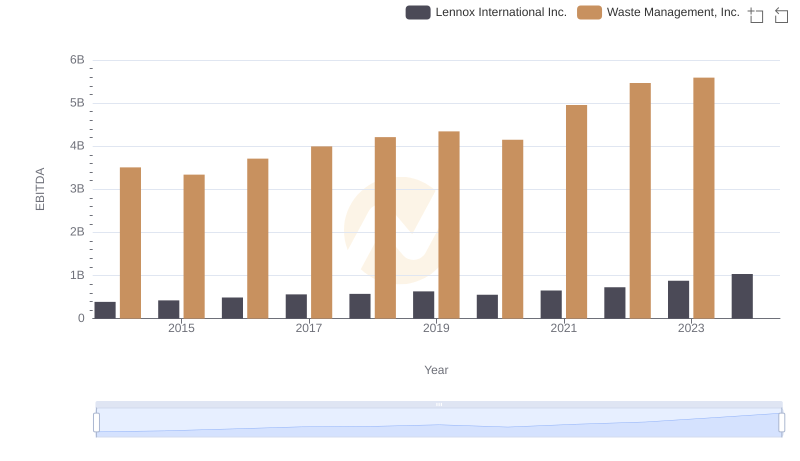
A Side-by-Side Analysis of EBITDA: Waste Management, Inc. and Lennox International Inc.