| __timestamp | Global Payments Inc. | Waste Management, Inc. |
|---|---|---|
| Wednesday, January 1, 2014 | 1295014000 | 1481000000 |
| Thursday, January 1, 2015 | 1325567000 | 1343000000 |
| Friday, January 1, 2016 | 1411096000 | 1410000000 |
| Sunday, January 1, 2017 | 1488258000 | 1468000000 |
| Monday, January 1, 2018 | 1534297000 | 1453000000 |
| Tuesday, January 1, 2019 | 2046672000 | 1631000000 |
| Wednesday, January 1, 2020 | 2878878000 | 1728000000 |
| Friday, January 1, 2021 | 3391161000 | 1864000000 |
| Saturday, January 1, 2022 | 3524578000 | 1938000000 |
| Sunday, January 1, 2023 | 4073768000 | 1926000000 |
| Monday, January 1, 2024 | 4285307000 | 2264000000 |
Unleashing insights
In the evolving landscape of corporate finance, understanding the trends in Selling, General, and Administrative (SG&A) expenses is crucial for investors and analysts alike. Over the past decade, Global Payments Inc. has seen a remarkable increase in its SG&A expenses, growing by over 200% from 2014 to 2023. This surge reflects the company's aggressive expansion and integration strategies. In contrast, Waste Management, Inc. has maintained a more stable trajectory, with a modest increase of around 30% over the same period. This stability underscores its focus on operational efficiency and cost management. The data highlights a stark contrast in business strategies: while Global Payments Inc. invests heavily in growth, Waste Management, Inc. prioritizes steady, sustainable operations. These insights provide a window into the strategic priorities of these industry giants, offering valuable lessons for stakeholders and competitors.
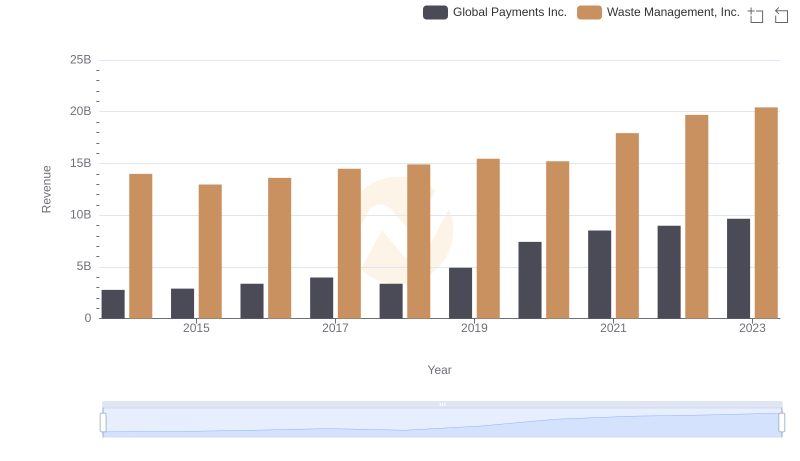
Revenue Showdown: Waste Management, Inc. vs Global Payments Inc.
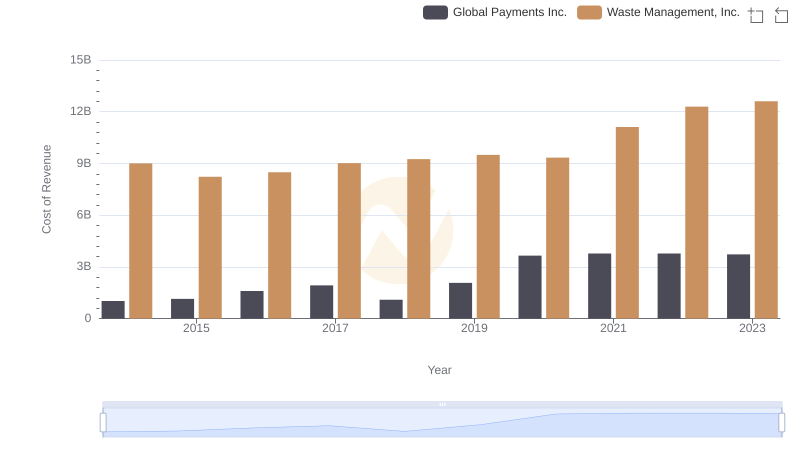
Cost of Revenue Trends: Waste Management, Inc. vs Global Payments Inc.
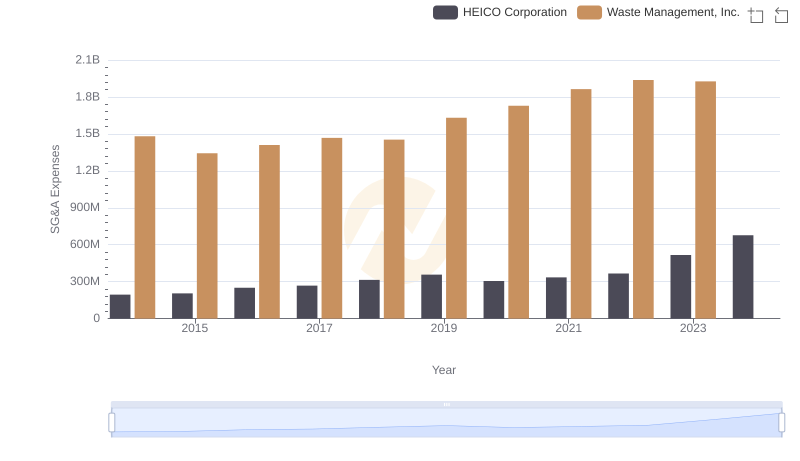
Breaking Down SG&A Expenses: Waste Management, Inc. vs HEICO Corporation

Waste Management, Inc. and Global Payments Inc.: A Detailed Gross Profit Analysis
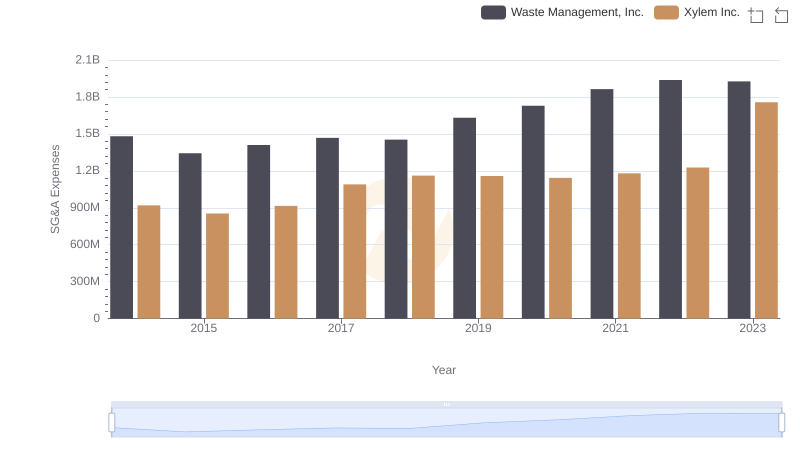
Breaking Down SG&A Expenses: Waste Management, Inc. vs Xylem Inc.
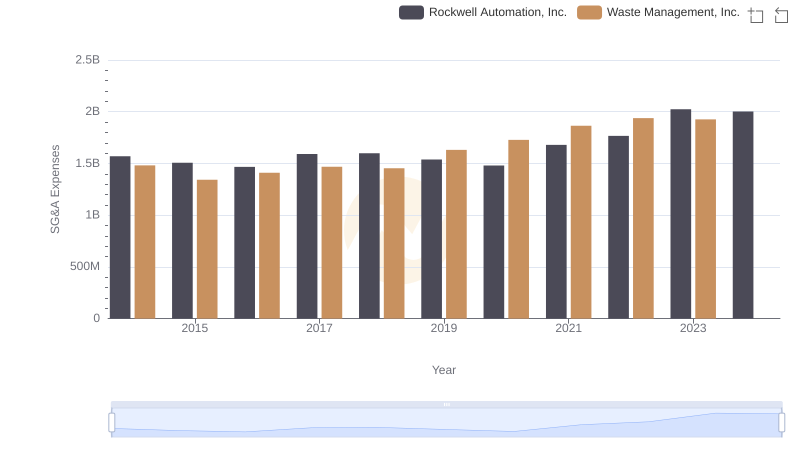
Cost Management Insights: SG&A Expenses for Waste Management, Inc. and Rockwell Automation, Inc.
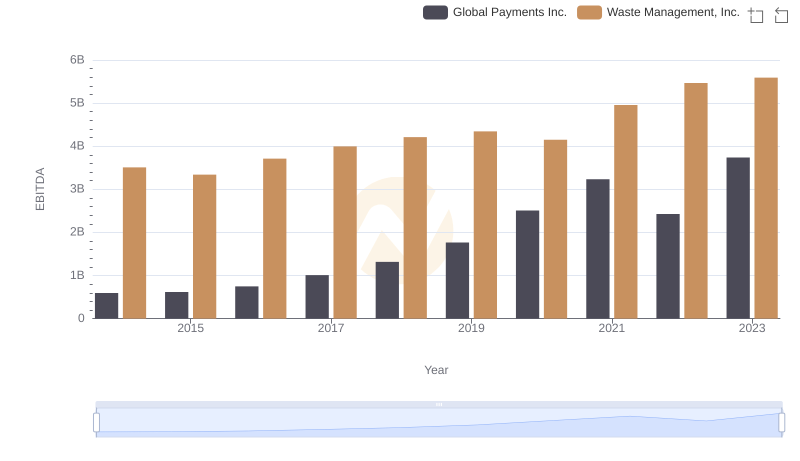
A Professional Review of EBITDA: Waste Management, Inc. Compared to Global Payments Inc.
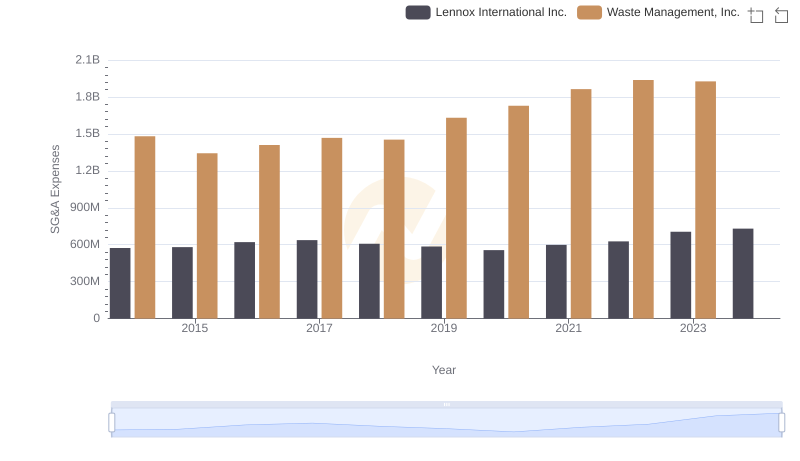
Waste Management, Inc. vs Lennox International Inc.: SG&A Expense Trends
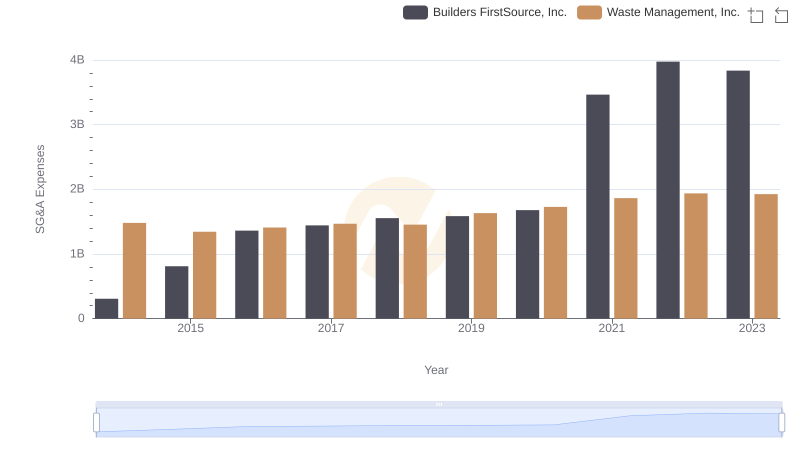
Who Optimizes SG&A Costs Better? Waste Management, Inc. or Builders FirstSource, Inc.