| __timestamp | Pool Corporation | United Rentals, Inc. |
|---|---|---|
| Wednesday, January 1, 2014 | 204752000 | 1678000000 |
| Thursday, January 1, 2015 | 233610000 | 2653000000 |
| Friday, January 1, 2016 | 277836000 | 2566000000 |
| Sunday, January 1, 2017 | 310096000 | 2843000000 |
| Monday, January 1, 2018 | 341804000 | 3628000000 |
| Tuesday, January 1, 2019 | 370520000 | 4200000000 |
| Wednesday, January 1, 2020 | 493425000 | 2195000000 |
| Friday, January 1, 2021 | 862810000 | 2642000000 |
| Saturday, January 1, 2022 | 1064808000 | 5464000000 |
| Sunday, January 1, 2023 | 786707000 | 6627000000 |
| Monday, January 1, 2024 | 4516000000 |
Data in motion
In the ever-evolving landscape of the equipment rental and pool supply industries, United Rentals, Inc. and Pool Corporation have emerged as formidable players. Over the past decade, United Rentals has consistently outperformed Pool Corporation in terms of EBITDA, showcasing a robust growth trajectory. From 2014 to 2023, United Rentals' EBITDA surged by nearly 295%, peaking in 2023, while Pool Corporation experienced a more modest growth of approximately 284% during the same period.
As we look to the future, the missing data for 2024 leaves room for speculation and anticipation in these dynamic industries.
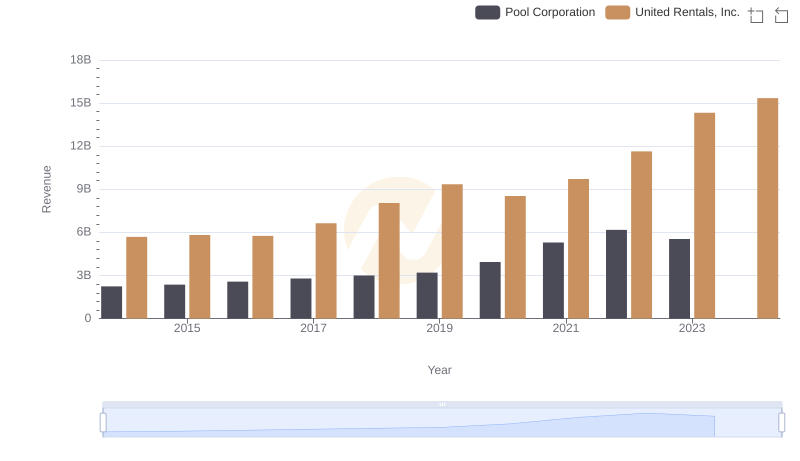
Annual Revenue Comparison: United Rentals, Inc. vs Pool Corporation
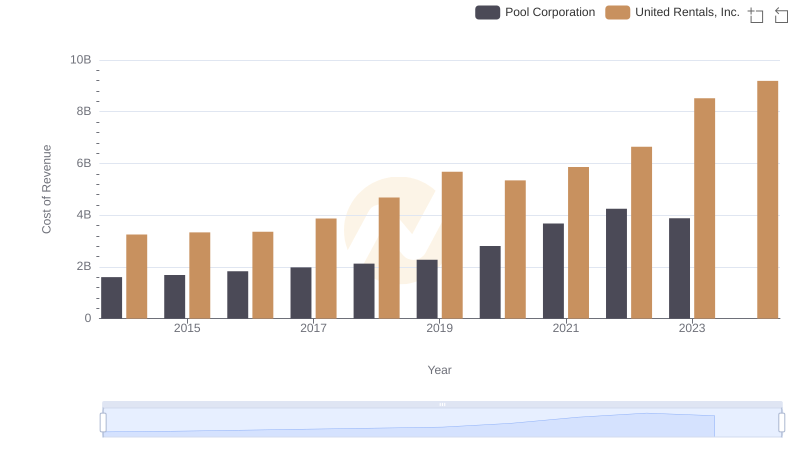
United Rentals, Inc. vs Pool Corporation: Efficiency in Cost of Revenue Explored
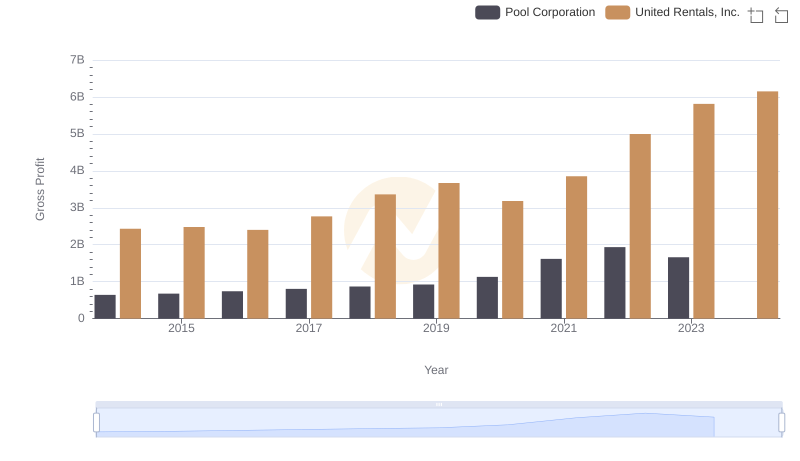
United Rentals, Inc. vs Pool Corporation: A Gross Profit Performance Breakdown
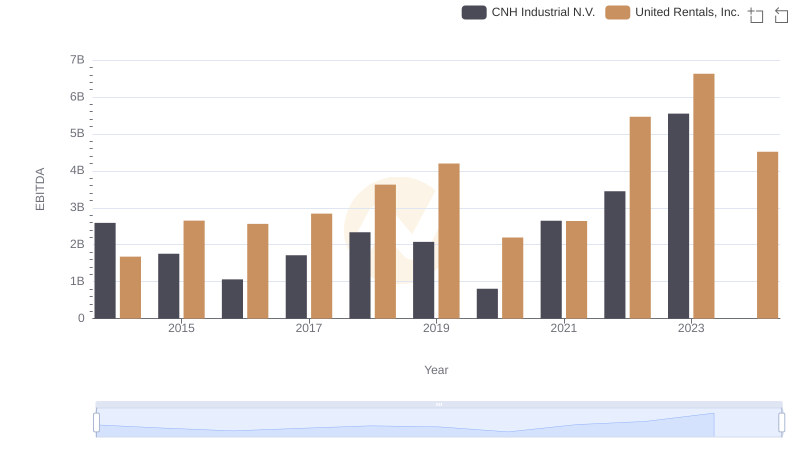
Comprehensive EBITDA Comparison: United Rentals, Inc. vs CNH Industrial N.V.
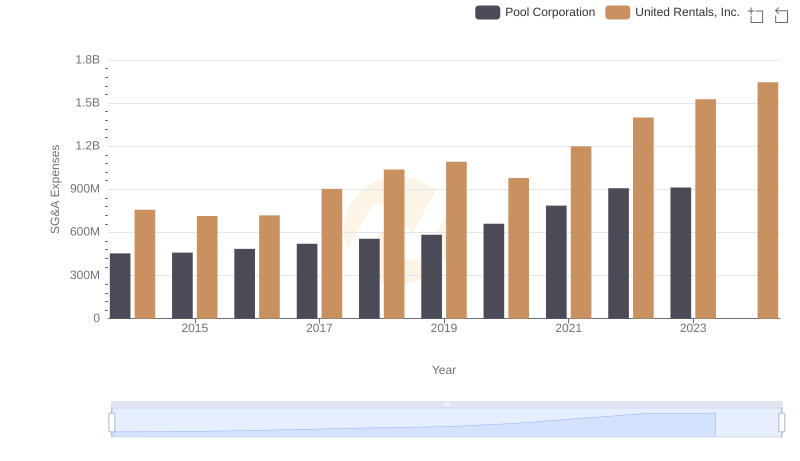
Cost Management Insights: SG&A Expenses for United Rentals, Inc. and Pool Corporation
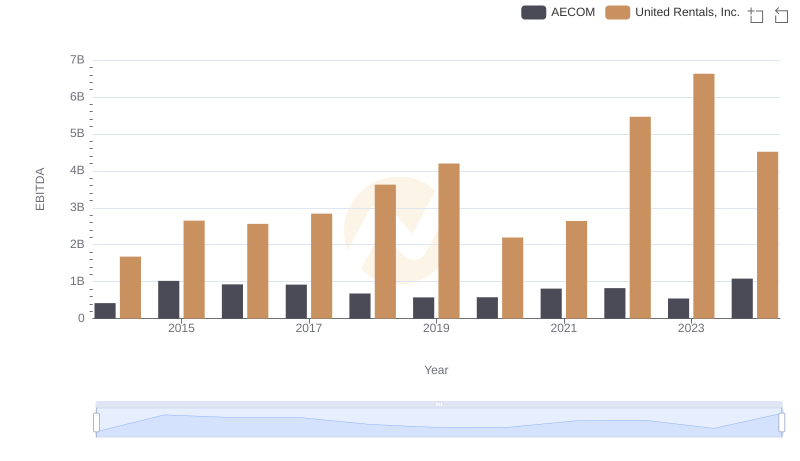
A Professional Review of EBITDA: United Rentals, Inc. Compared to AECOM

Comprehensive EBITDA Comparison: United Rentals, Inc. vs Stanley Black & Decker, Inc.
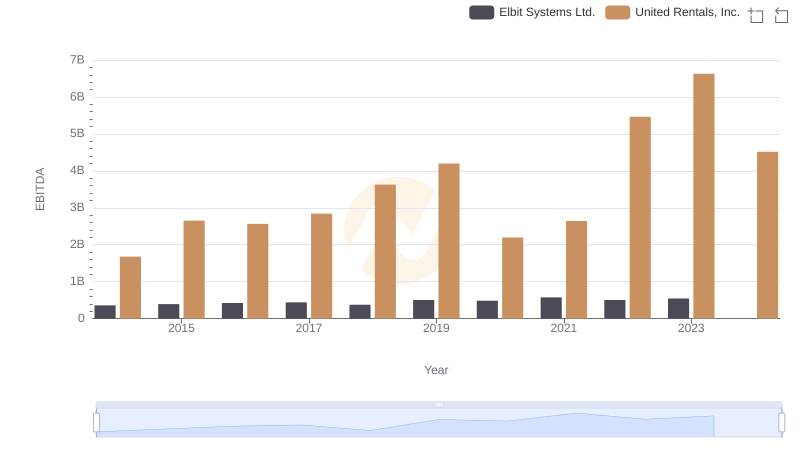
A Side-by-Side Analysis of EBITDA: United Rentals, Inc. and Elbit Systems Ltd.
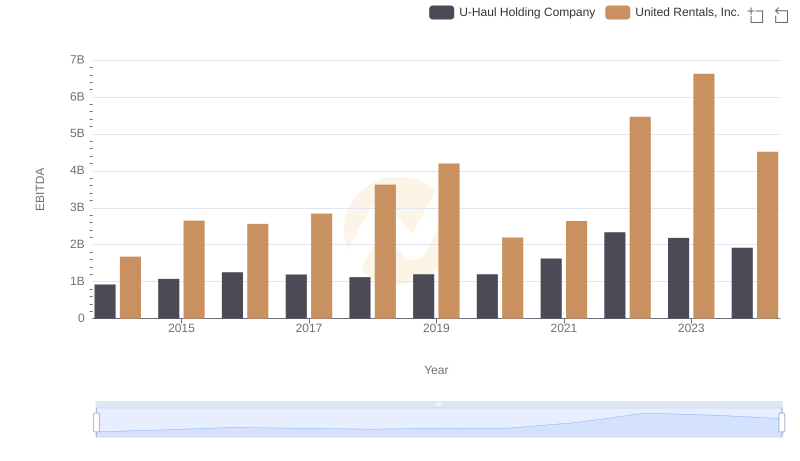
EBITDA Metrics Evaluated: United Rentals, Inc. vs U-Haul Holding Company
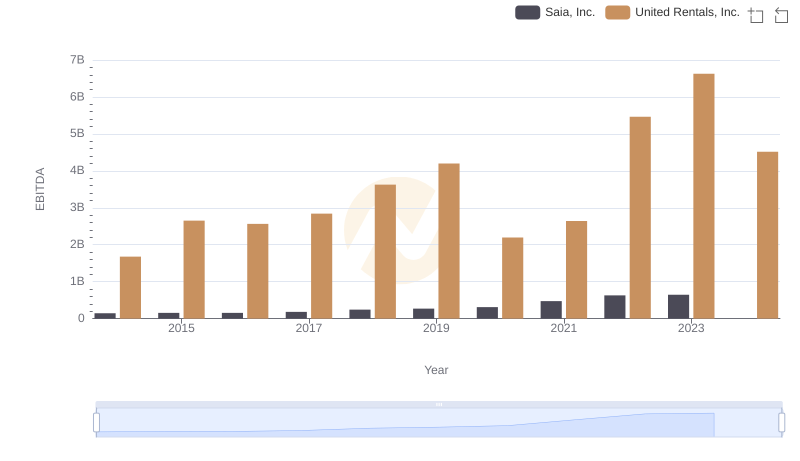
United Rentals, Inc. vs Saia, Inc.: In-Depth EBITDA Performance Comparison