| __timestamp | Pool Corporation | United Rentals, Inc. |
|---|---|---|
| Wednesday, January 1, 2014 | 643340000 | 2432000000 |
| Thursday, January 1, 2015 | 675644000 | 2480000000 |
| Friday, January 1, 2016 | 741087000 | 2403000000 |
| Sunday, January 1, 2017 | 805289000 | 2769000000 |
| Monday, January 1, 2018 | 870173000 | 3364000000 |
| Tuesday, January 1, 2019 | 924925000 | 3670000000 |
| Wednesday, January 1, 2020 | 1130902000 | 3183000000 |
| Friday, January 1, 2021 | 1617092000 | 3853000000 |
| Saturday, January 1, 2022 | 1933412000 | 4996000000 |
| Sunday, January 1, 2023 | 1660044000 | 5813000000 |
| Monday, January 1, 2024 | 6150000000 |
Unveiling the hidden dimensions of data
In the competitive landscape of the equipment rental and pool supply industries, United Rentals, Inc. and Pool Corporation have showcased remarkable growth over the past decade. From 2014 to 2023, United Rentals, Inc. has consistently outperformed Pool Corporation in terms of gross profit, with a staggering 140% increase, peaking at approximately $5.8 billion in 2023. Meanwhile, Pool Corporation demonstrated a robust 158% growth, reaching around $1.7 billion in 2023.
This data underscores the dynamic nature of these industries and the strategic maneuvers by these companies to maintain their market positions.
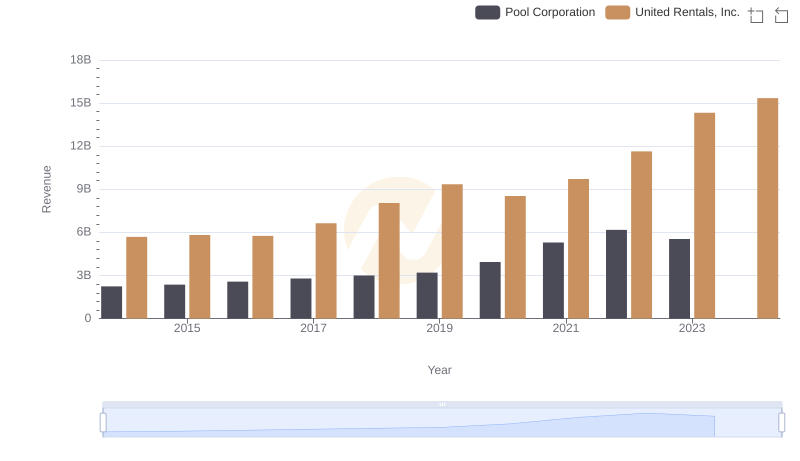
Annual Revenue Comparison: United Rentals, Inc. vs Pool Corporation
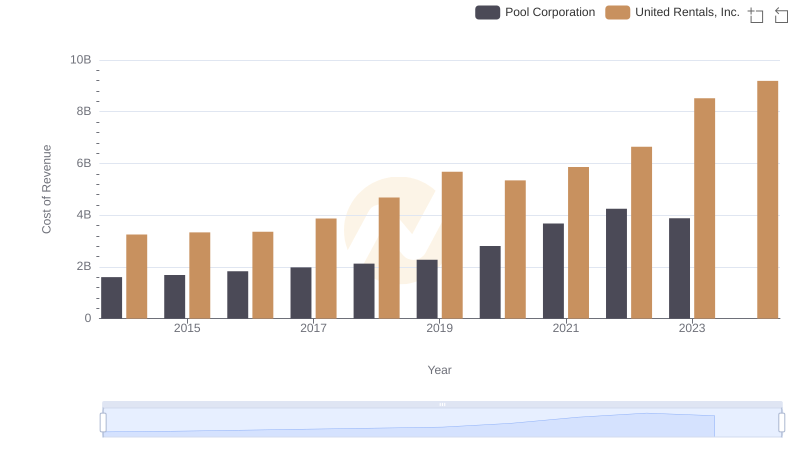
United Rentals, Inc. vs Pool Corporation: Efficiency in Cost of Revenue Explored
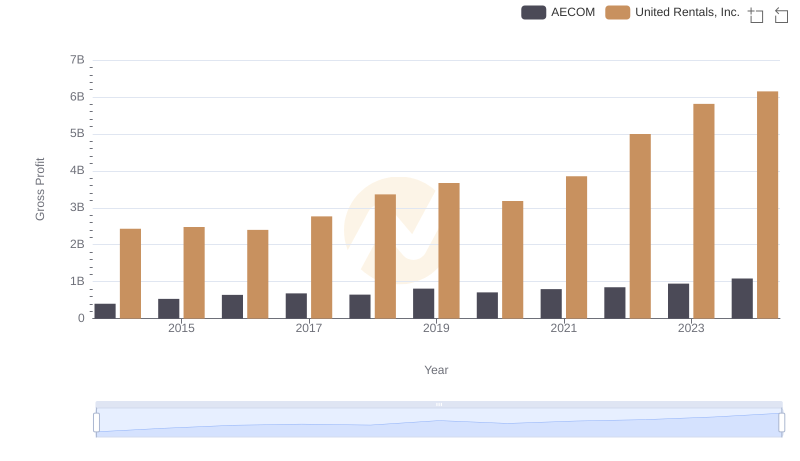
United Rentals, Inc. and AECOM: A Detailed Gross Profit Analysis
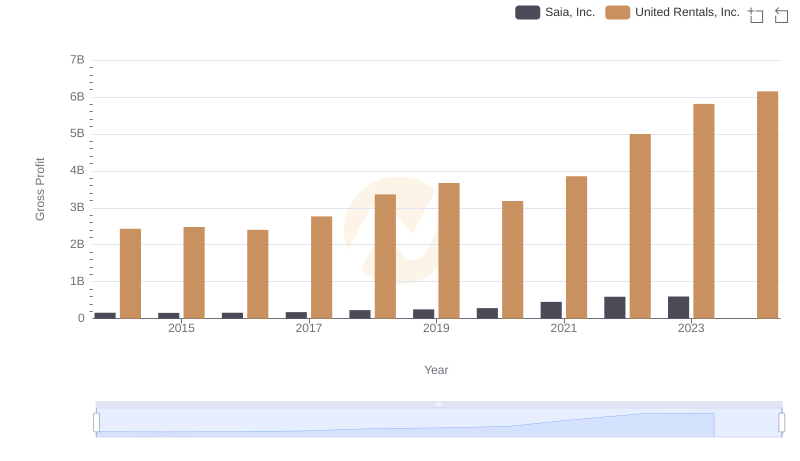
Gross Profit Comparison: United Rentals, Inc. and Saia, Inc. Trends

United Rentals, Inc. and Stanley Black & Decker, Inc.: A Detailed Gross Profit Analysis

Gross Profit Comparison: United Rentals, Inc. and U-Haul Holding Company Trends
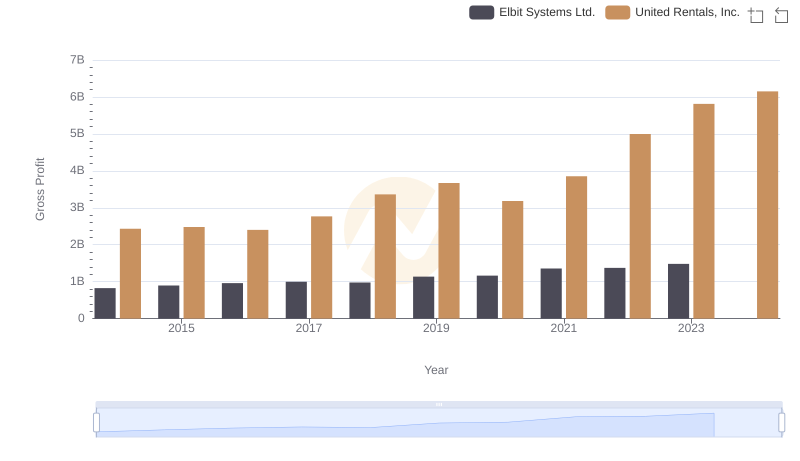
Gross Profit Analysis: Comparing United Rentals, Inc. and Elbit Systems Ltd.

Gross Profit Trends Compared: United Rentals, Inc. vs C.H. Robinson Worldwide, Inc.
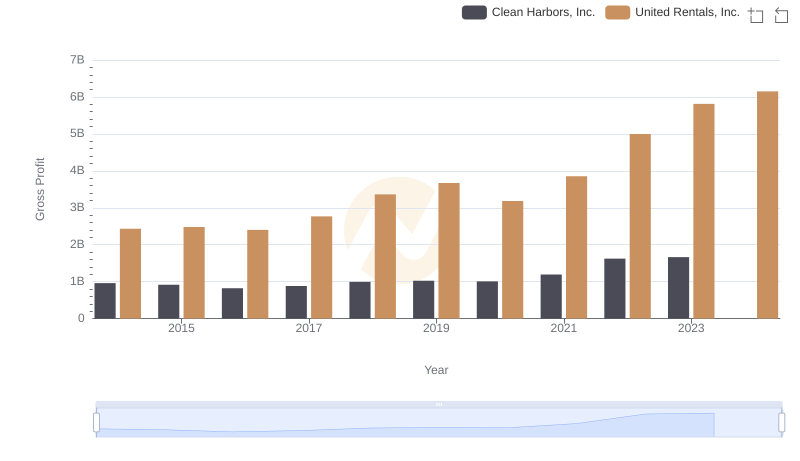
United Rentals, Inc. and Clean Harbors, Inc.: A Detailed Gross Profit Analysis

United Rentals, Inc. and Curtiss-Wright Corporation: A Detailed Gross Profit Analysis
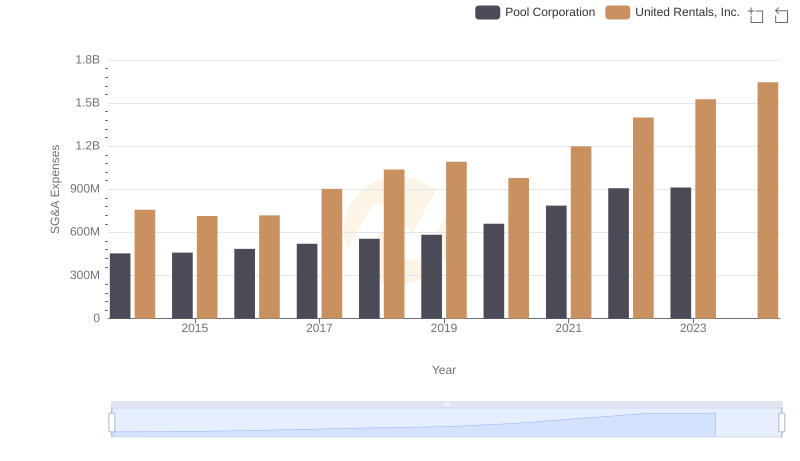
Cost Management Insights: SG&A Expenses for United Rentals, Inc. and Pool Corporation
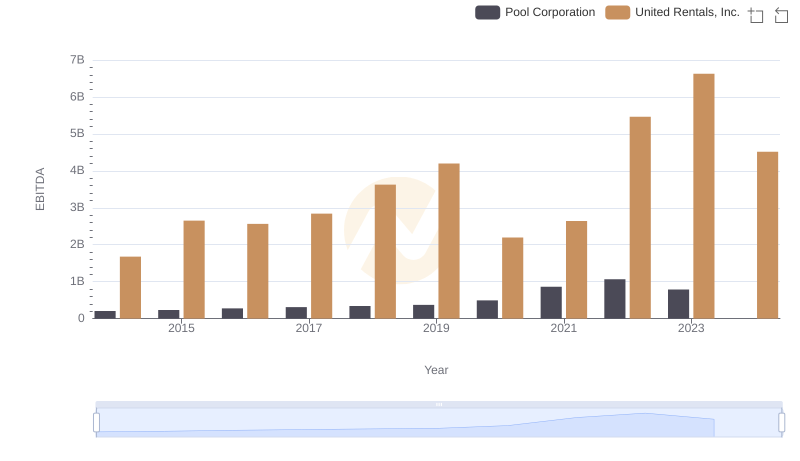
Comparative EBITDA Analysis: United Rentals, Inc. vs Pool Corporation