| __timestamp | AECOM | United Rentals, Inc. |
|---|---|---|
| Wednesday, January 1, 2014 | 4452451000 | 3253000000 |
| Thursday, January 1, 2015 | 17454692000 | 3337000000 |
| Friday, January 1, 2016 | 16768001000 | 3359000000 |
| Sunday, January 1, 2017 | 17519682000 | 3872000000 |
| Monday, January 1, 2018 | 19504863000 | 4683000000 |
| Tuesday, January 1, 2019 | 19359884000 | 5681000000 |
| Wednesday, January 1, 2020 | 12530416000 | 5347000000 |
| Friday, January 1, 2021 | 12542431000 | 5863000000 |
| Saturday, January 1, 2022 | 12300208000 | 6646000000 |
| Sunday, January 1, 2023 | 13432996000 | 8519000000 |
| Monday, January 1, 2024 | 15021157000 | 9195000000 |
Igniting the spark of knowledge
In the competitive landscape of the construction and rental industries, AECOM and United Rentals, Inc. have been pivotal players. Over the past decade, AECOM's cost of revenue has consistently outpaced that of United Rentals, Inc., with a peak in 2018 reaching nearly 20 billion dollars. This figure represents a staggering 340% increase from its 2014 baseline. In contrast, United Rentals, Inc. has shown a steady upward trend, with its cost of revenue growing by approximately 180% over the same period, culminating in 2024 with a cost of nearly 9.2 billion dollars.
The data reveals a fascinating narrative of growth and adaptation, with AECOM's cost of revenue being consistently higher, reflecting its expansive operations. Meanwhile, United Rentals, Inc.'s more modest but steady growth underscores its strategic focus on efficiency and market penetration. This comparison offers a unique insight into the operational dynamics of these industry leaders.
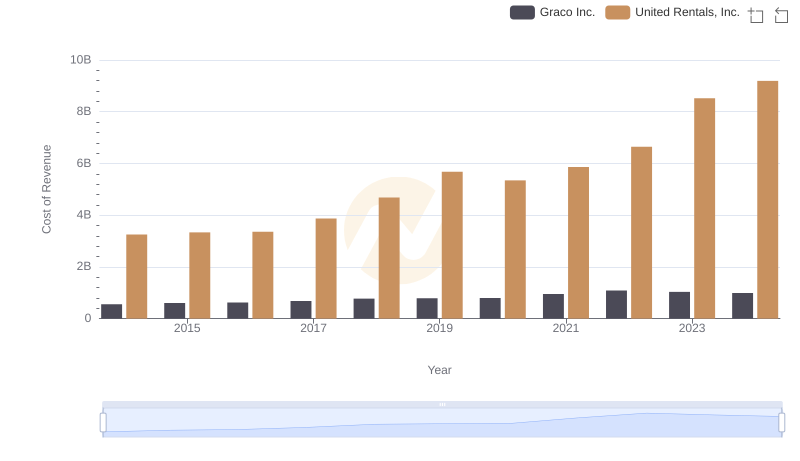
Analyzing Cost of Revenue: United Rentals, Inc. and Graco Inc.
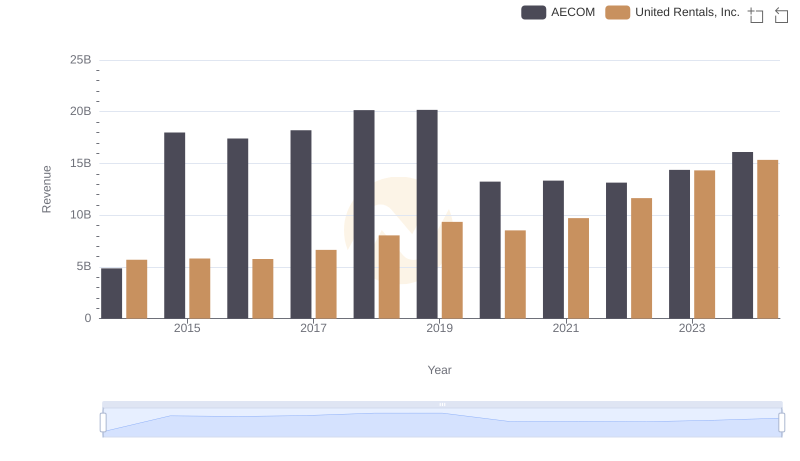
United Rentals, Inc. or AECOM: Who Leads in Yearly Revenue?
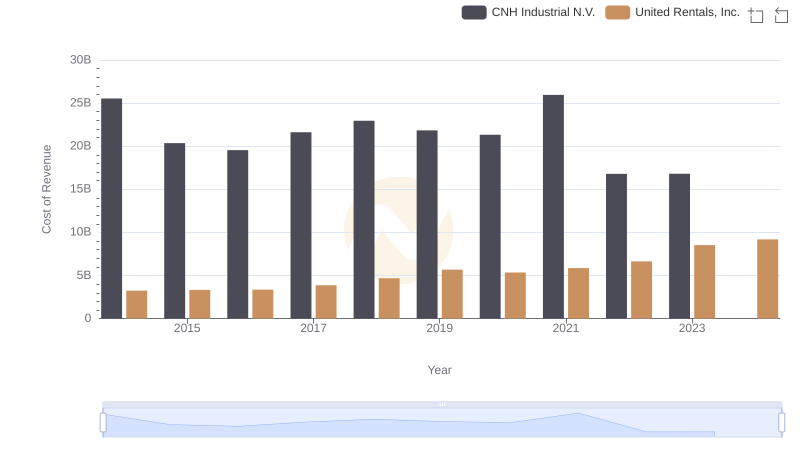
Comparing Cost of Revenue Efficiency: United Rentals, Inc. vs CNH Industrial N.V.
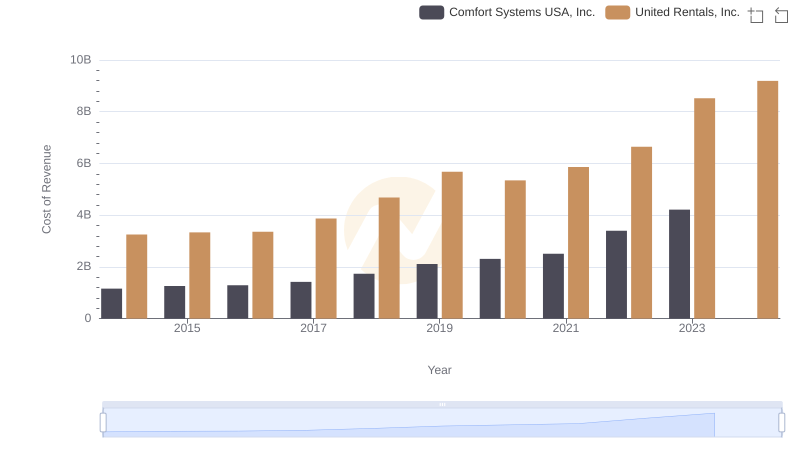
Cost of Revenue Trends: United Rentals, Inc. vs Comfort Systems USA, Inc.
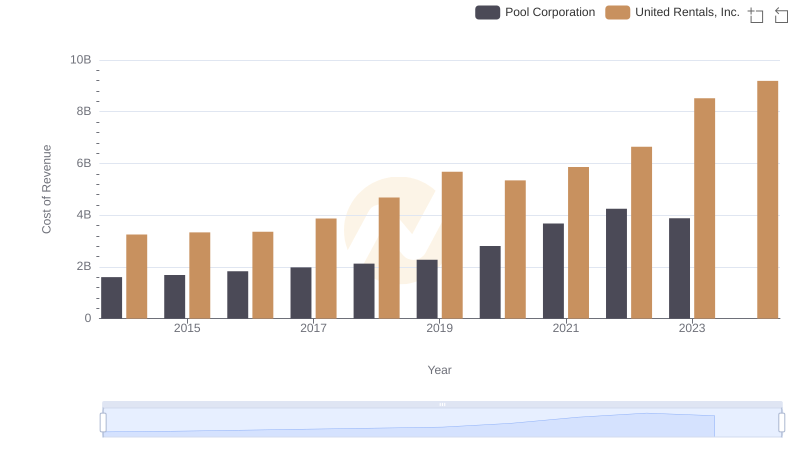
United Rentals, Inc. vs Pool Corporation: Efficiency in Cost of Revenue Explored
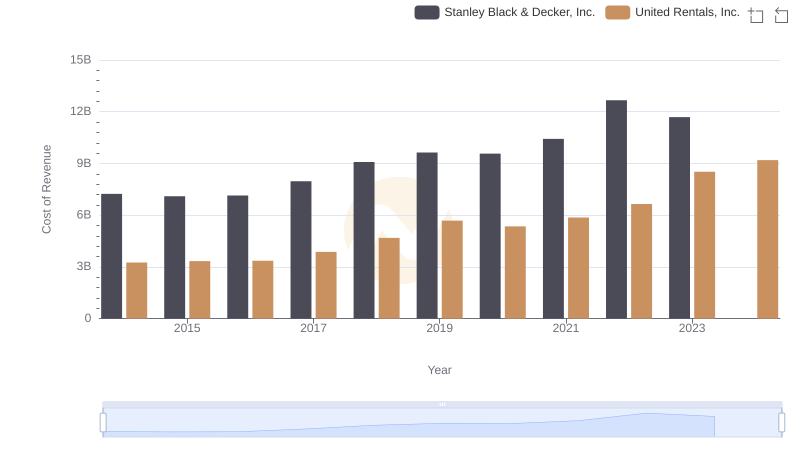
Comparing Cost of Revenue Efficiency: United Rentals, Inc. vs Stanley Black & Decker, Inc.
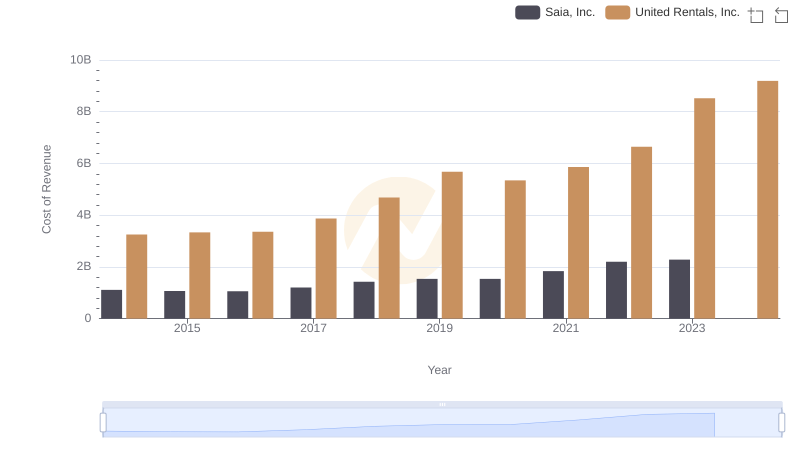
Cost of Revenue Comparison: United Rentals, Inc. vs Saia, Inc.
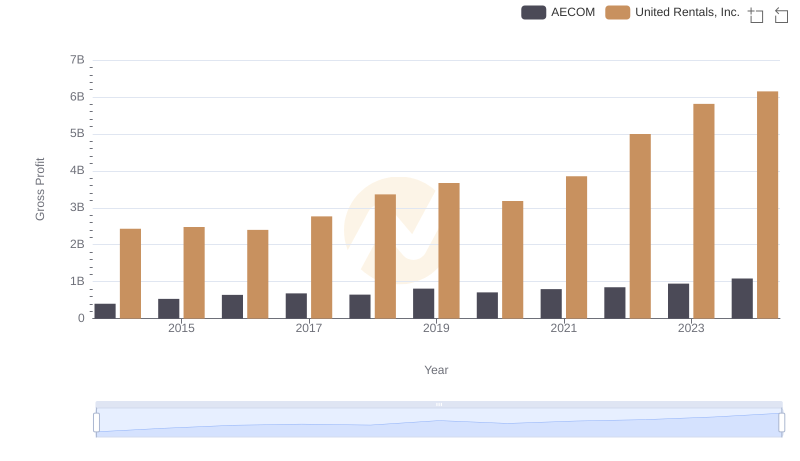
United Rentals, Inc. and AECOM: A Detailed Gross Profit Analysis
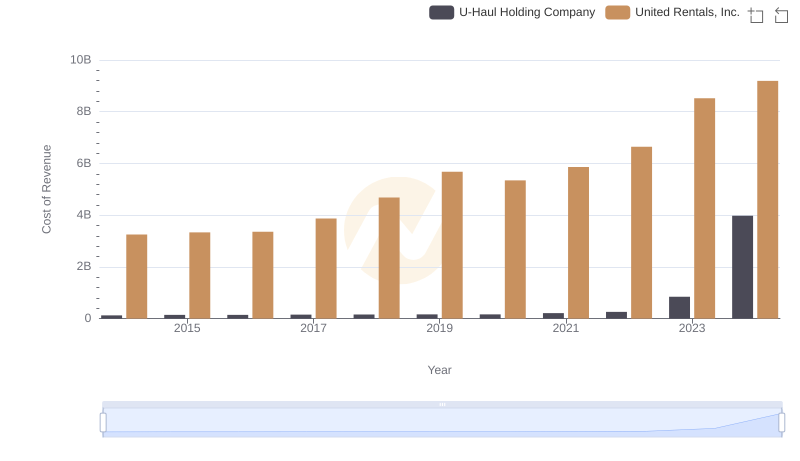
Cost of Revenue Comparison: United Rentals, Inc. vs U-Haul Holding Company
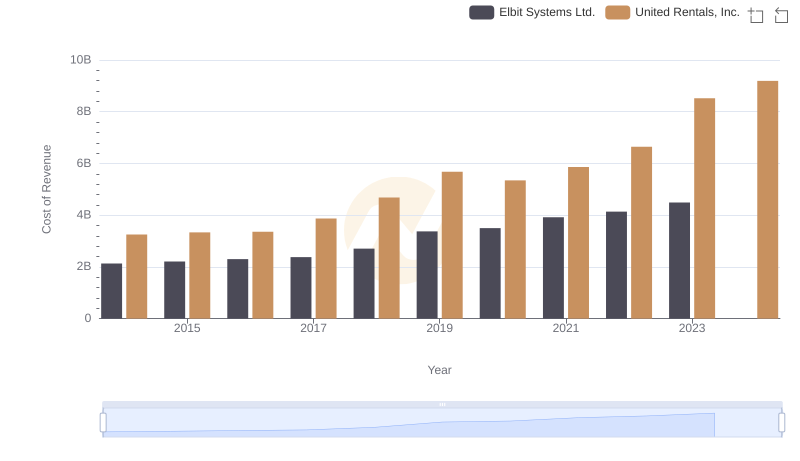
Comparing Cost of Revenue Efficiency: United Rentals, Inc. vs Elbit Systems Ltd.
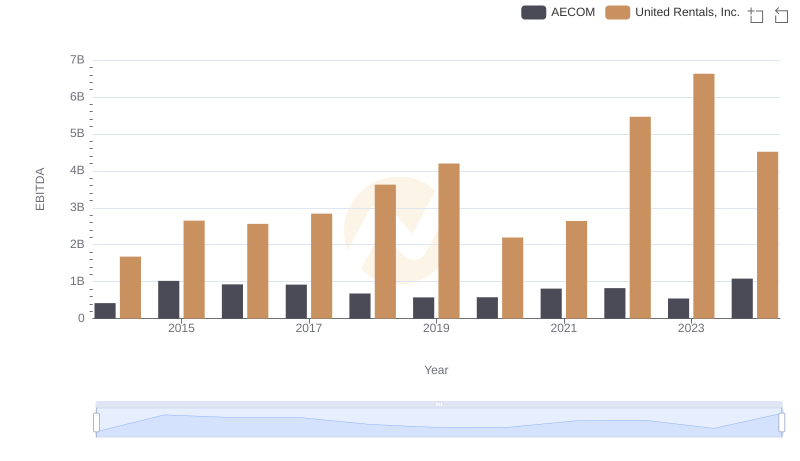
A Professional Review of EBITDA: United Rentals, Inc. Compared to AECOM