| __timestamp | Elbit Systems Ltd. | United Rentals, Inc. |
|---|---|---|
| Wednesday, January 1, 2014 | 2133151000 | 3253000000 |
| Thursday, January 1, 2015 | 2210528000 | 3337000000 |
| Friday, January 1, 2016 | 2300636000 | 3359000000 |
| Sunday, January 1, 2017 | 2379905000 | 3872000000 |
| Monday, January 1, 2018 | 2707505000 | 4683000000 |
| Tuesday, January 1, 2019 | 3371933000 | 5681000000 |
| Wednesday, January 1, 2020 | 3497465000 | 5347000000 |
| Friday, January 1, 2021 | 3920473000 | 5863000000 |
| Saturday, January 1, 2022 | 4138266000 | 6646000000 |
| Sunday, January 1, 2023 | 4491790000 | 8519000000 |
| Monday, January 1, 2024 | 9195000000 |
Data in motion
In the competitive landscape of global industries, understanding cost efficiency is paramount. United Rentals, Inc. and Elbit Systems Ltd. offer a fascinating comparison in this regard. Over the past decade, United Rentals has consistently outpaced Elbit Systems in cost of revenue, with a notable 162% increase from 2014 to 2023. In contrast, Elbit Systems saw a 110% rise during the same period. This trend highlights United Rentals' aggressive expansion and operational efficiency, particularly in the equipment rental sector.
The data for 2024 is incomplete, leaving room for speculation on future trends.
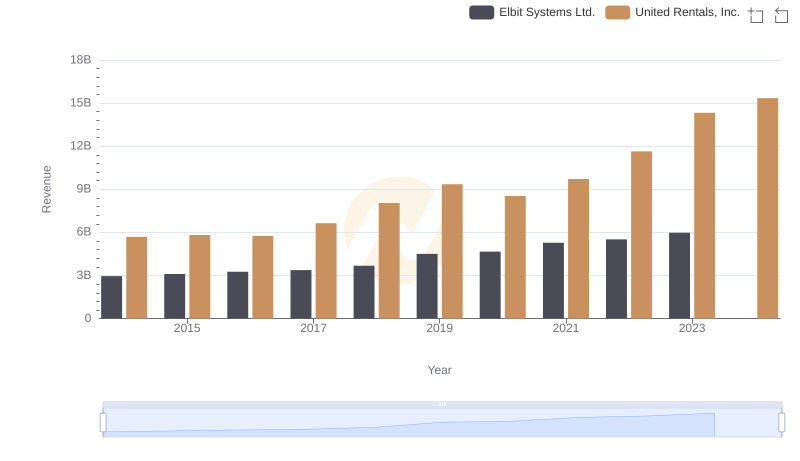
Breaking Down Revenue Trends: United Rentals, Inc. vs Elbit Systems Ltd.
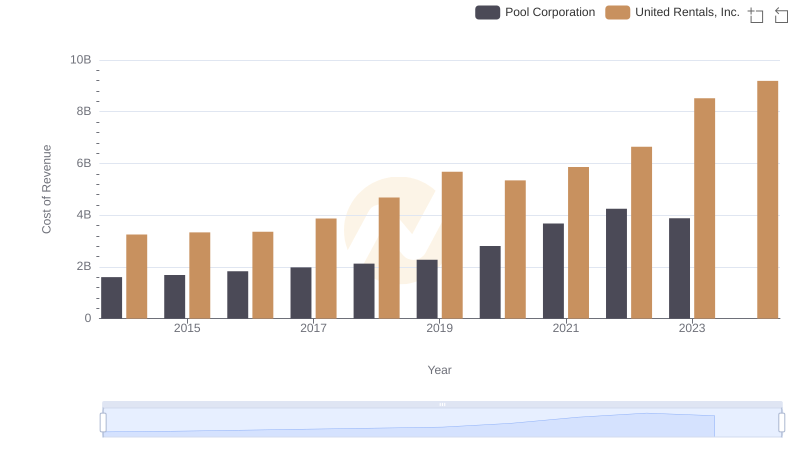
United Rentals, Inc. vs Pool Corporation: Efficiency in Cost of Revenue Explored
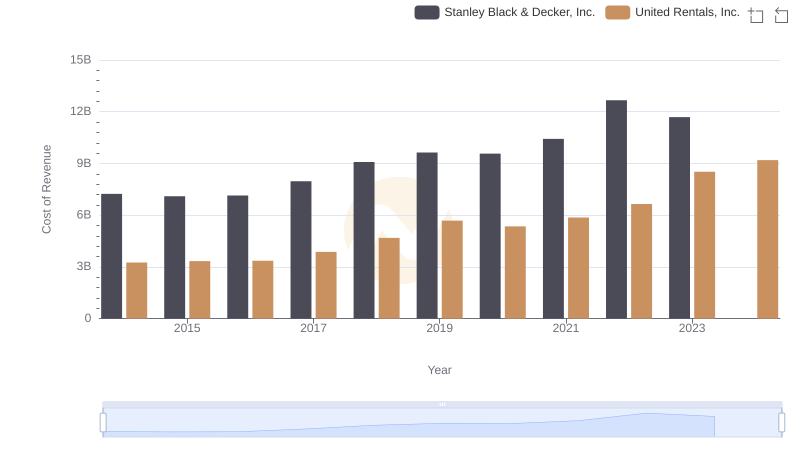
Comparing Cost of Revenue Efficiency: United Rentals, Inc. vs Stanley Black & Decker, Inc.
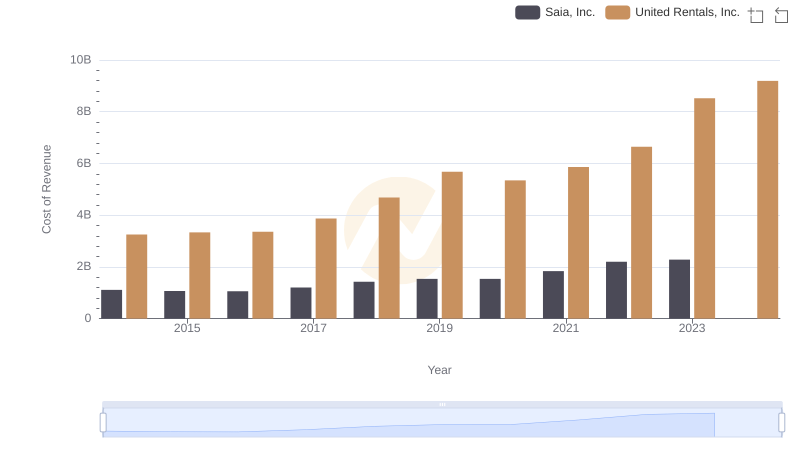
Cost of Revenue Comparison: United Rentals, Inc. vs Saia, Inc.
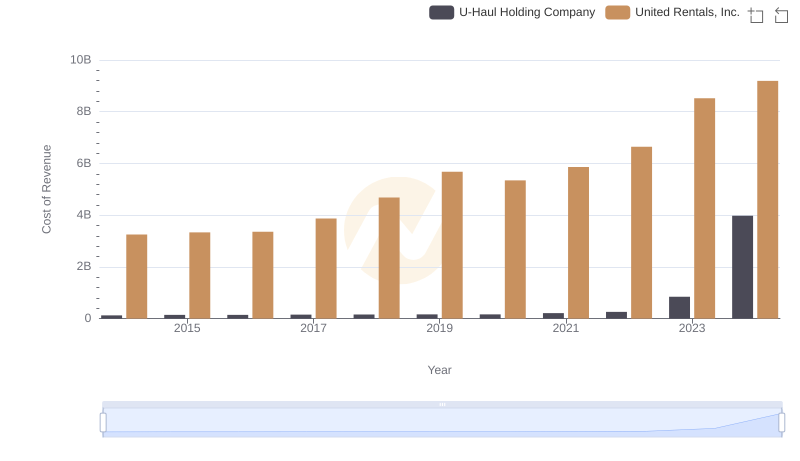
Cost of Revenue Comparison: United Rentals, Inc. vs U-Haul Holding Company
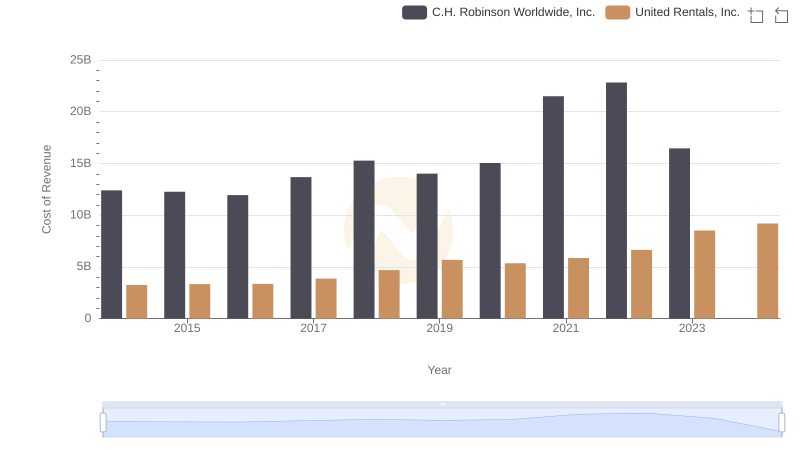
United Rentals, Inc. vs C.H. Robinson Worldwide, Inc.: Efficiency in Cost of Revenue Explored
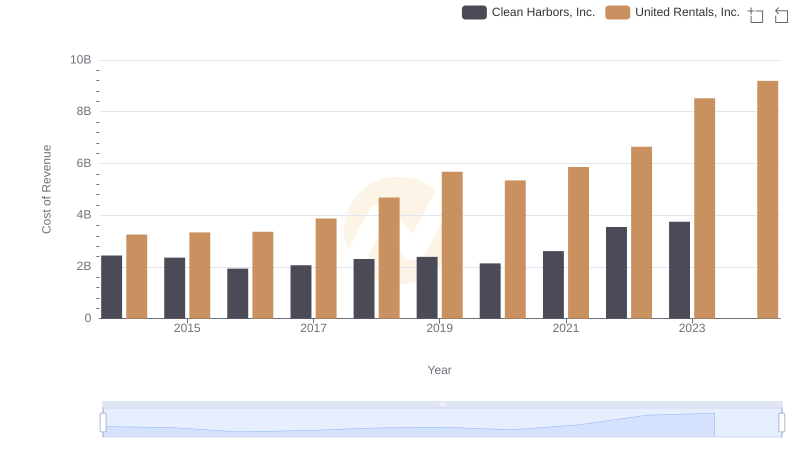
Cost of Revenue: Key Insights for United Rentals, Inc. and Clean Harbors, Inc.
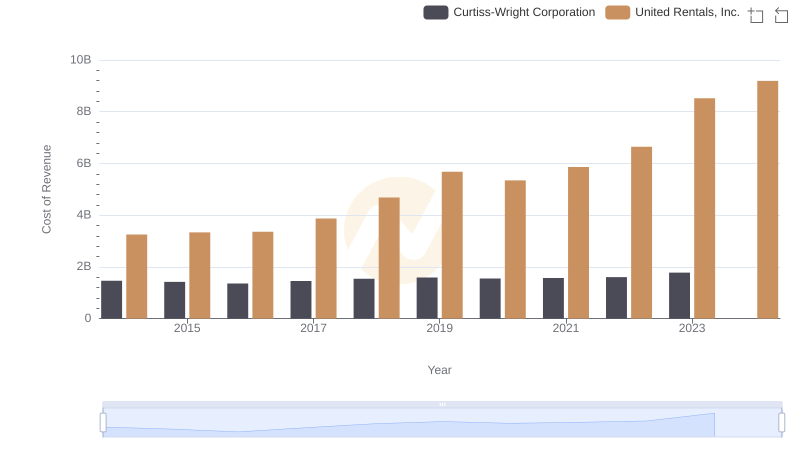
Cost of Revenue Trends: United Rentals, Inc. vs Curtiss-Wright Corporation
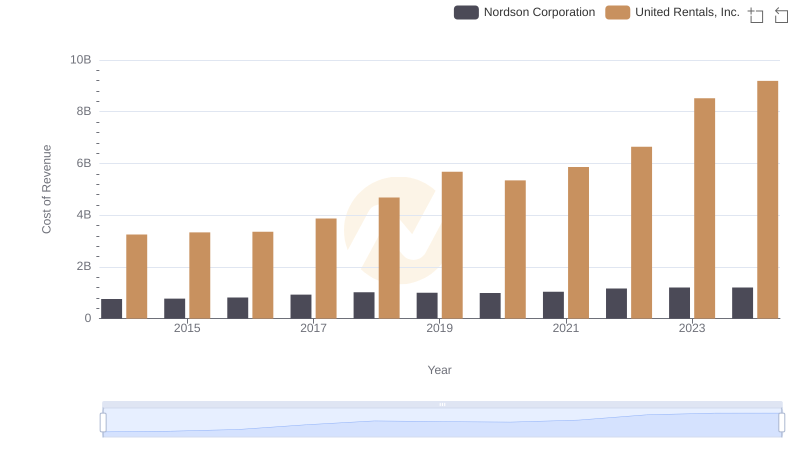
Comparing Cost of Revenue Efficiency: United Rentals, Inc. vs Nordson Corporation
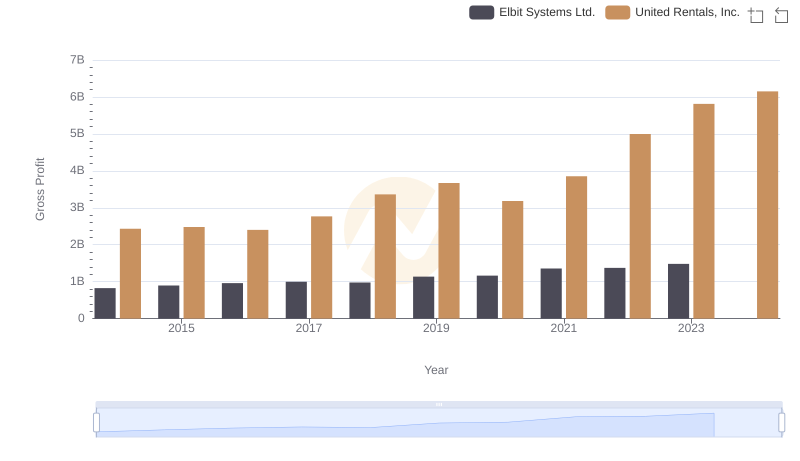
Gross Profit Analysis: Comparing United Rentals, Inc. and Elbit Systems Ltd.
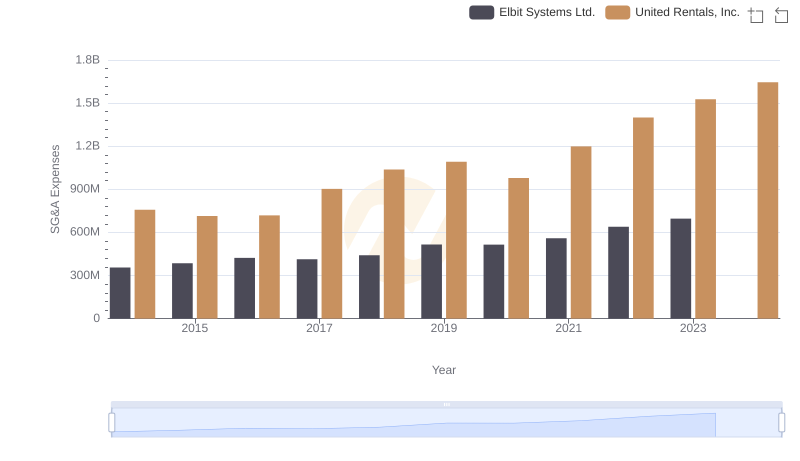
Operational Costs Compared: SG&A Analysis of United Rentals, Inc. and Elbit Systems Ltd.
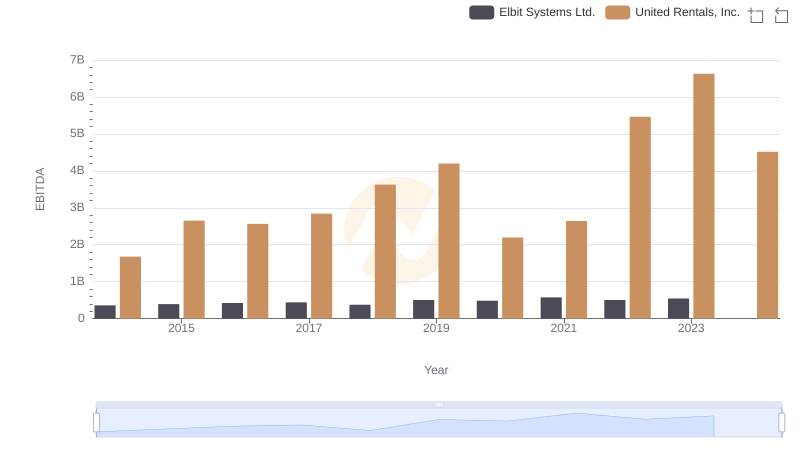
A Side-by-Side Analysis of EBITDA: United Rentals, Inc. and Elbit Systems Ltd.