| __timestamp | C.H. Robinson Worldwide, Inc. | United Rentals, Inc. |
|---|---|---|
| Wednesday, January 1, 2014 | 12401436000 | 3253000000 |
| Thursday, January 1, 2015 | 12259014000 | 3337000000 |
| Friday, January 1, 2016 | 11931821000 | 3359000000 |
| Sunday, January 1, 2017 | 13680857000 | 3872000000 |
| Monday, January 1, 2018 | 15269479000 | 4683000000 |
| Tuesday, January 1, 2019 | 14021726000 | 5681000000 |
| Wednesday, January 1, 2020 | 15037716000 | 5347000000 |
| Friday, January 1, 2021 | 21493659000 | 5863000000 |
| Saturday, January 1, 2022 | 22826428000 | 6646000000 |
| Sunday, January 1, 2023 | 16457570000 | 8519000000 |
| Monday, January 1, 2024 | 16416191000 | 9195000000 |
Unleashing the power of data
In the competitive landscape of American business, cost efficiency is a critical metric for success. This analysis delves into the cost of revenue trends for United Rentals, Inc. and C.H. Robinson Worldwide, Inc. from 2014 to 2023. Over this decade, C.H. Robinson Worldwide, Inc. consistently reported higher costs, peaking in 2022 with a 62% increase from 2014. In contrast, United Rentals, Inc. demonstrated a more controlled growth in costs, with a 182% rise over the same period, reflecting strategic scaling.
The data reveals a significant dip in C.H. Robinson's costs in 2023, suggesting potential operational shifts or market conditions. Meanwhile, United Rentals' steady increase indicates robust expansion strategies. Missing data for 2024 suggests ongoing developments. This comparative analysis underscores the dynamic nature of cost management in these industry giants, offering insights into their operational efficiencies.
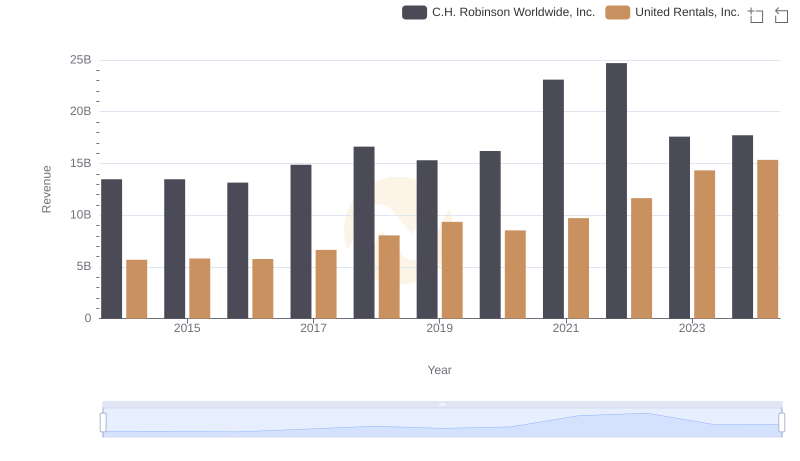
United Rentals, Inc. vs C.H. Robinson Worldwide, Inc.: Examining Key Revenue Metrics
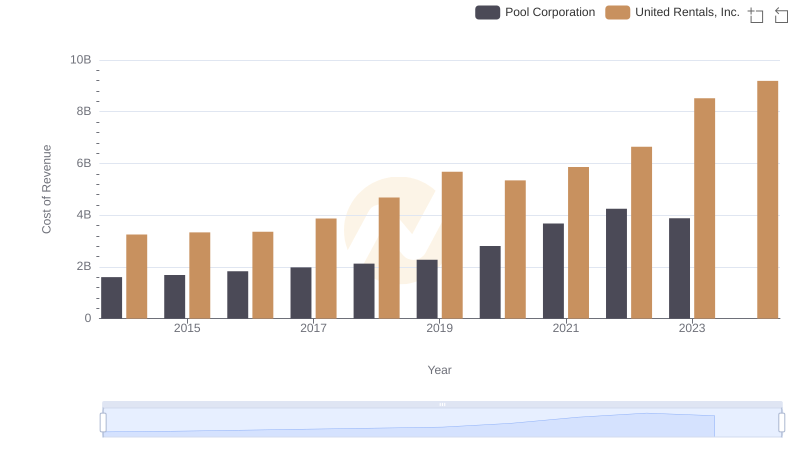
United Rentals, Inc. vs Pool Corporation: Efficiency in Cost of Revenue Explored
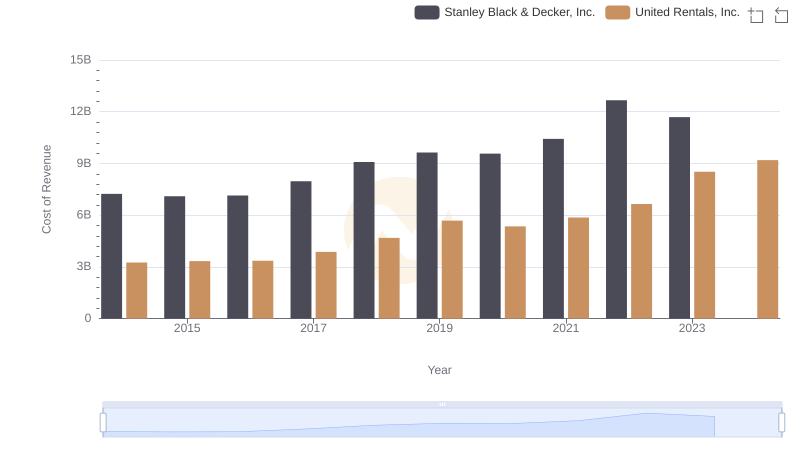
Comparing Cost of Revenue Efficiency: United Rentals, Inc. vs Stanley Black & Decker, Inc.
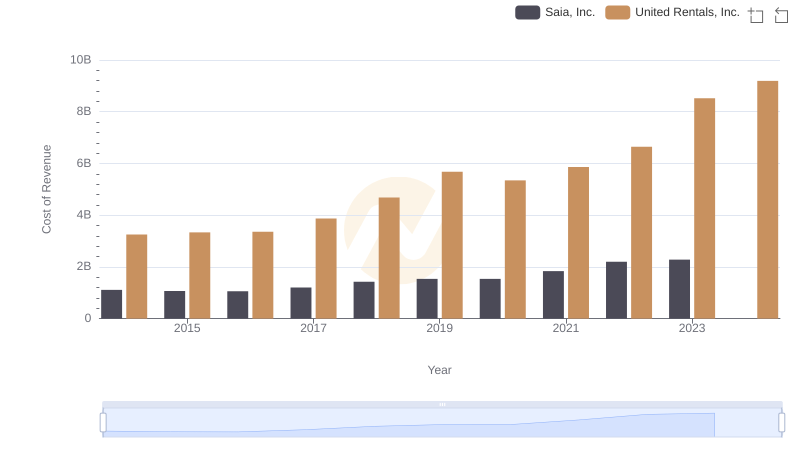
Cost of Revenue Comparison: United Rentals, Inc. vs Saia, Inc.
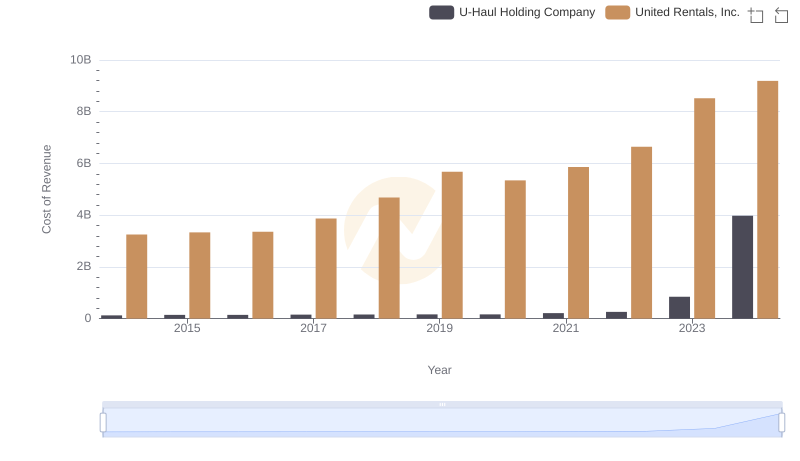
Cost of Revenue Comparison: United Rentals, Inc. vs U-Haul Holding Company
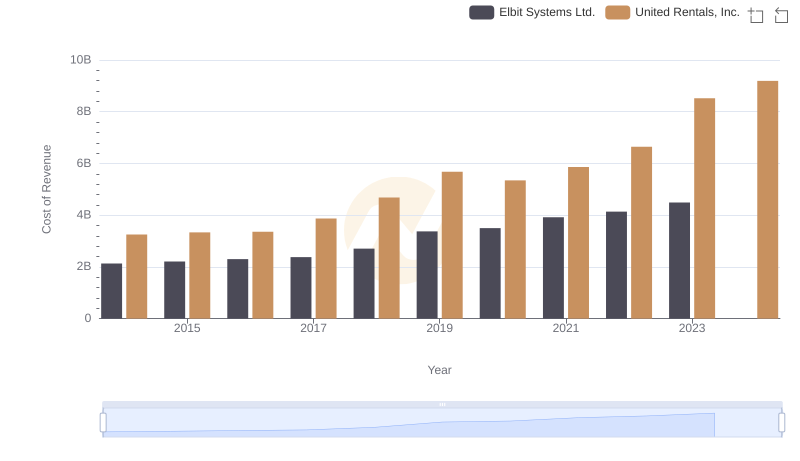
Comparing Cost of Revenue Efficiency: United Rentals, Inc. vs Elbit Systems Ltd.
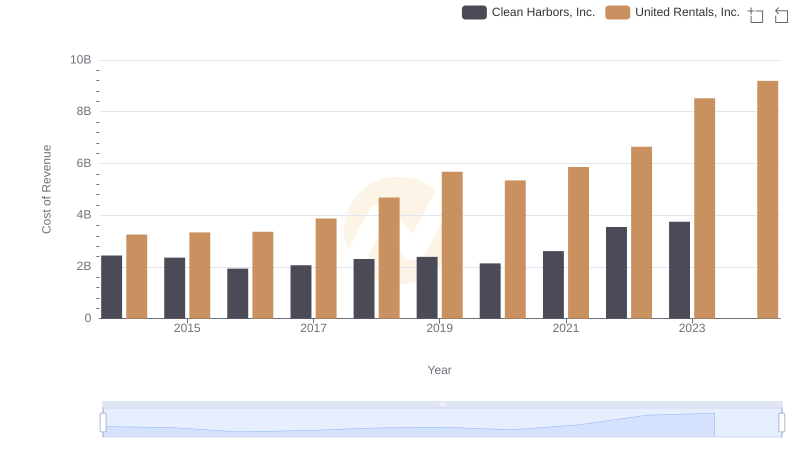
Cost of Revenue: Key Insights for United Rentals, Inc. and Clean Harbors, Inc.
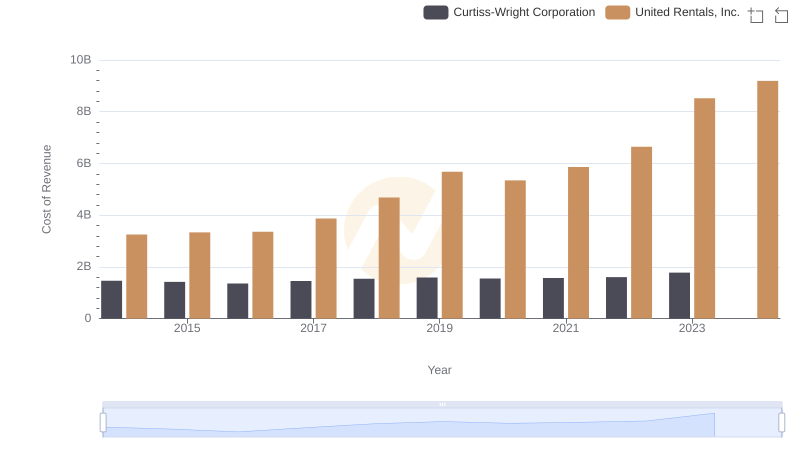
Cost of Revenue Trends: United Rentals, Inc. vs Curtiss-Wright Corporation
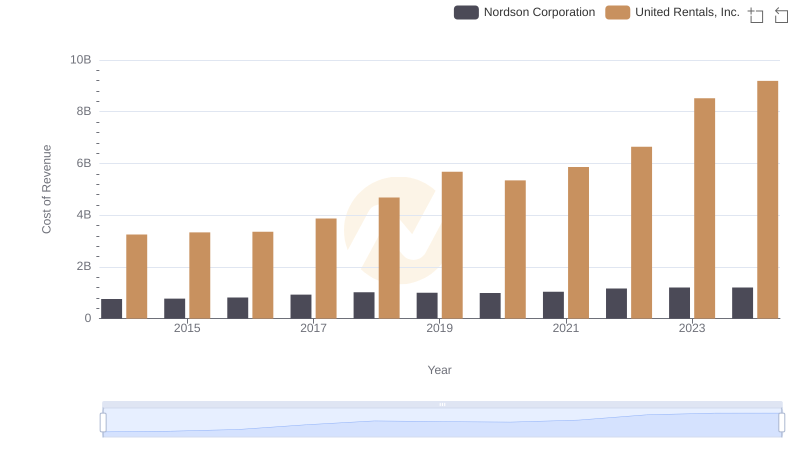
Comparing Cost of Revenue Efficiency: United Rentals, Inc. vs Nordson Corporation

Gross Profit Trends Compared: United Rentals, Inc. vs C.H. Robinson Worldwide, Inc.
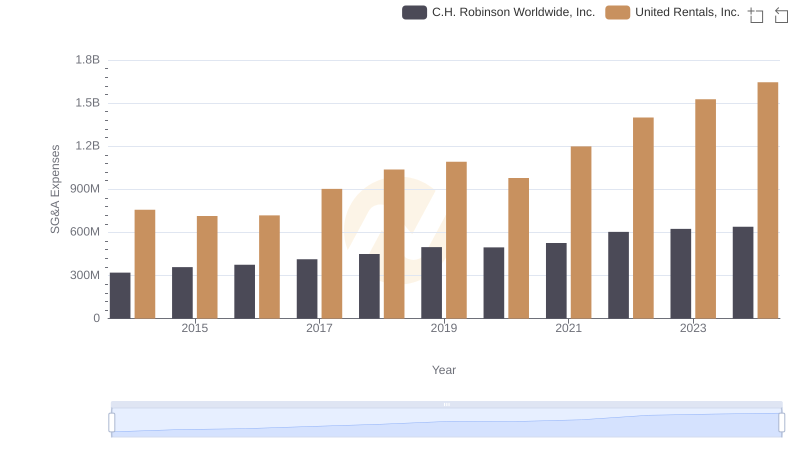
United Rentals, Inc. and C.H. Robinson Worldwide, Inc.: SG&A Spending Patterns Compared