| __timestamp | Comfort Systems USA, Inc. | United Rentals, Inc. |
|---|---|---|
| Wednesday, January 1, 2014 | 1161024000 | 3253000000 |
| Thursday, January 1, 2015 | 1262390000 | 3337000000 |
| Friday, January 1, 2016 | 1290331000 | 3359000000 |
| Sunday, January 1, 2017 | 1421641000 | 3872000000 |
| Monday, January 1, 2018 | 1736600000 | 4683000000 |
| Tuesday, January 1, 2019 | 2113334000 | 5681000000 |
| Wednesday, January 1, 2020 | 2309676000 | 5347000000 |
| Friday, January 1, 2021 | 2510429000 | 5863000000 |
| Saturday, January 1, 2022 | 3398756000 | 6646000000 |
| Sunday, January 1, 2023 | 4216251000 | 8519000000 |
| Monday, January 1, 2024 | 9195000000 |
Unveiling the hidden dimensions of data
In the ever-evolving landscape of the construction and rental industries, United Rentals, Inc. and Comfort Systems USA, Inc. have showcased intriguing cost of revenue trends over the past decade. Since 2014, United Rentals has consistently outpaced Comfort Systems, with its cost of revenue growing by approximately 182% by 2023. This growth reflects the company's aggressive expansion and market dominance. Comfort Systems, while trailing, has also seen a significant increase of around 263% in the same period, indicating robust growth in its sector.
The data reveals a fascinating narrative of industry dynamics, with United Rentals reaching a peak cost of revenue in 2024, despite missing data for Comfort Systems in that year. This trend underscores the resilience and strategic maneuvers of these industry leaders, offering valuable insights for investors and market analysts alike.
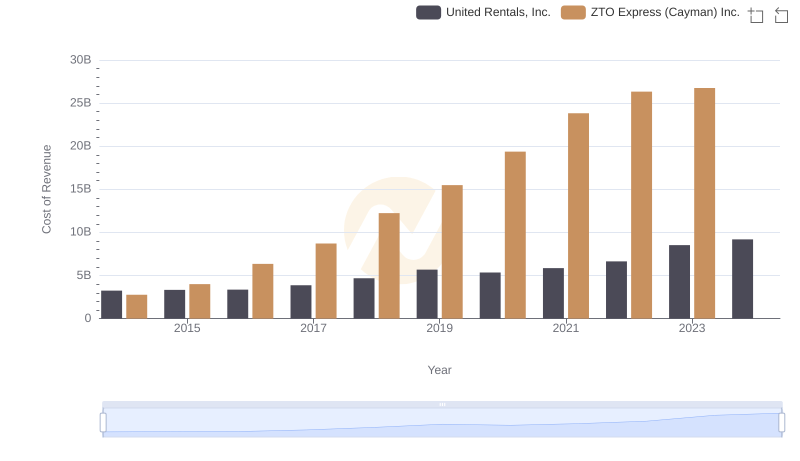
Comparing Cost of Revenue Efficiency: United Rentals, Inc. vs ZTO Express (Cayman) Inc.
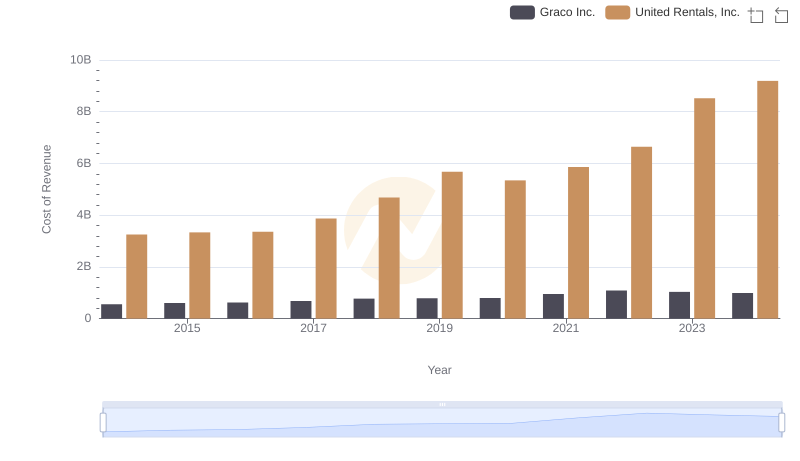
Analyzing Cost of Revenue: United Rentals, Inc. and Graco Inc.
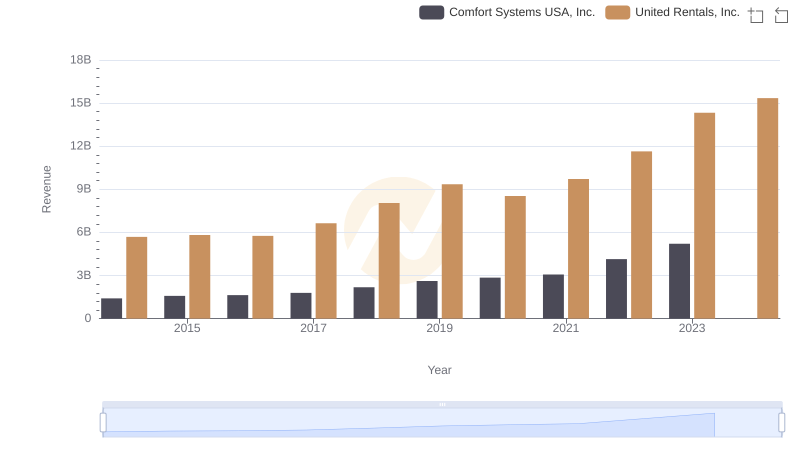
Breaking Down Revenue Trends: United Rentals, Inc. vs Comfort Systems USA, Inc.
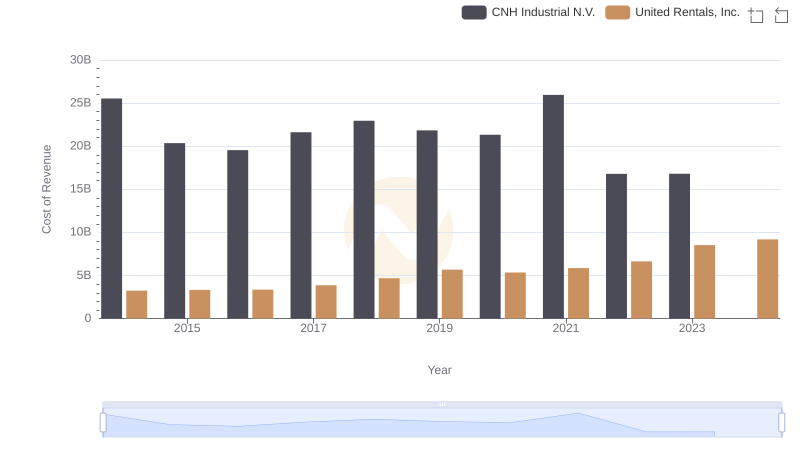
Comparing Cost of Revenue Efficiency: United Rentals, Inc. vs CNH Industrial N.V.
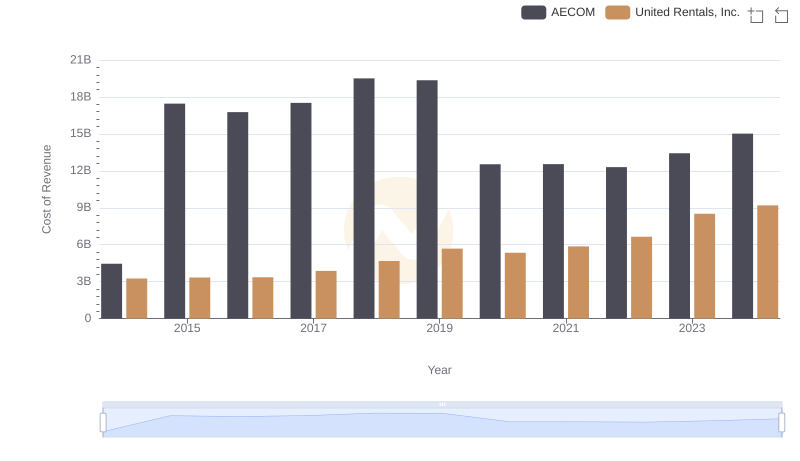
Cost of Revenue Comparison: United Rentals, Inc. vs AECOM
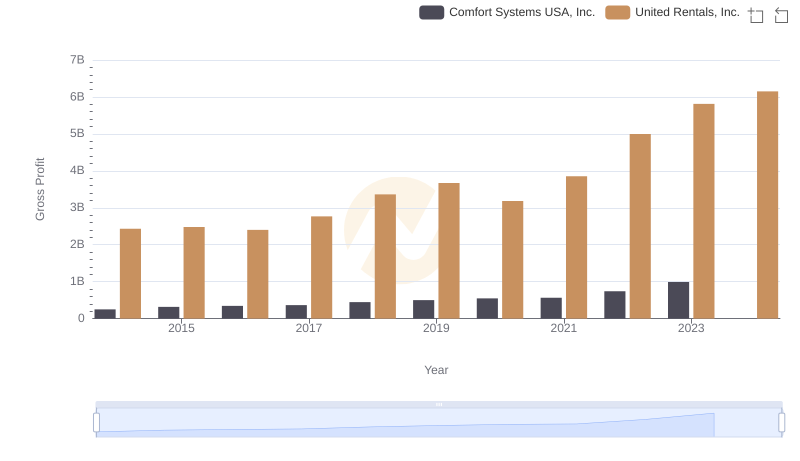
Gross Profit Trends Compared: United Rentals, Inc. vs Comfort Systems USA, Inc.
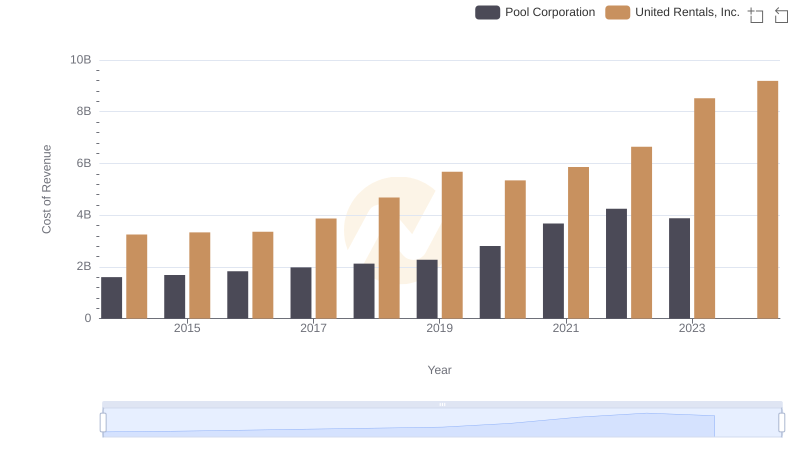
United Rentals, Inc. vs Pool Corporation: Efficiency in Cost of Revenue Explored
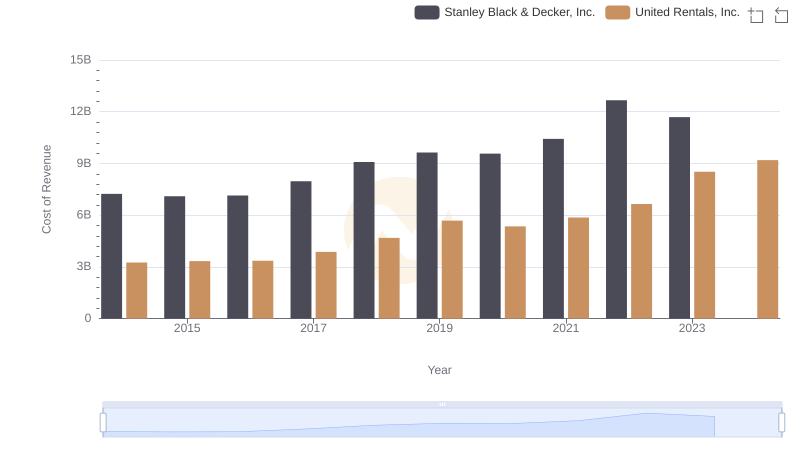
Comparing Cost of Revenue Efficiency: United Rentals, Inc. vs Stanley Black & Decker, Inc.
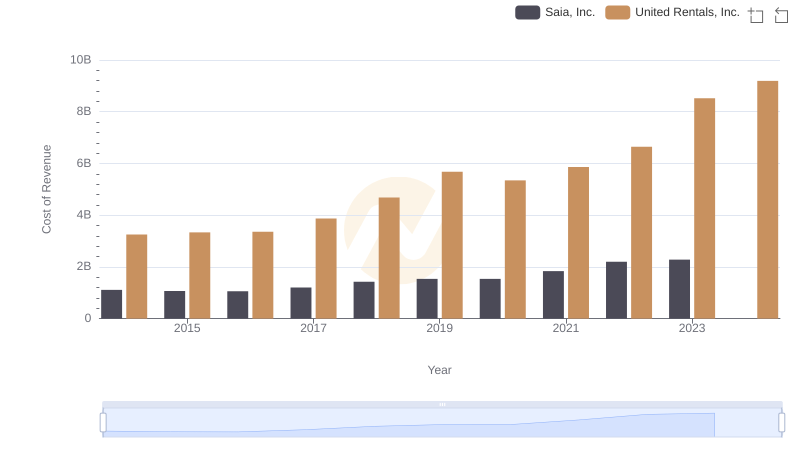
Cost of Revenue Comparison: United Rentals, Inc. vs Saia, Inc.
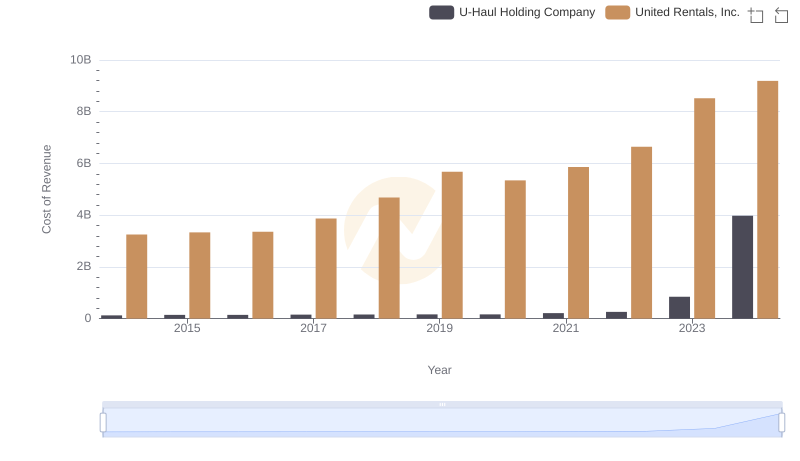
Cost of Revenue Comparison: United Rentals, Inc. vs U-Haul Holding Company
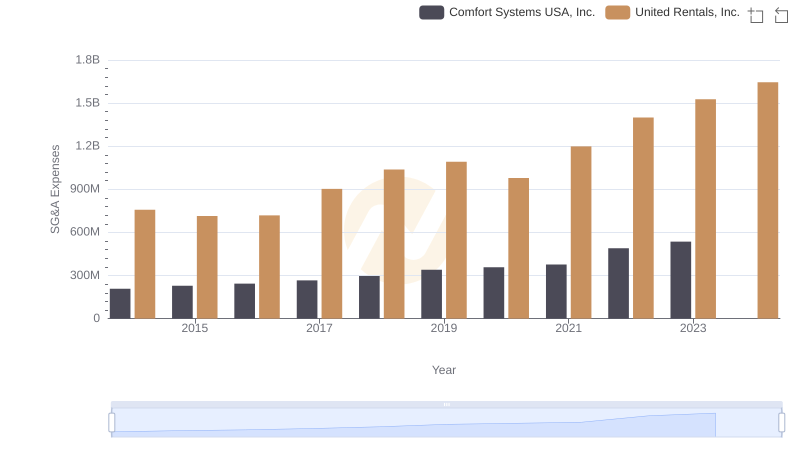
United Rentals, Inc. and Comfort Systems USA, Inc.: SG&A Spending Patterns Compared
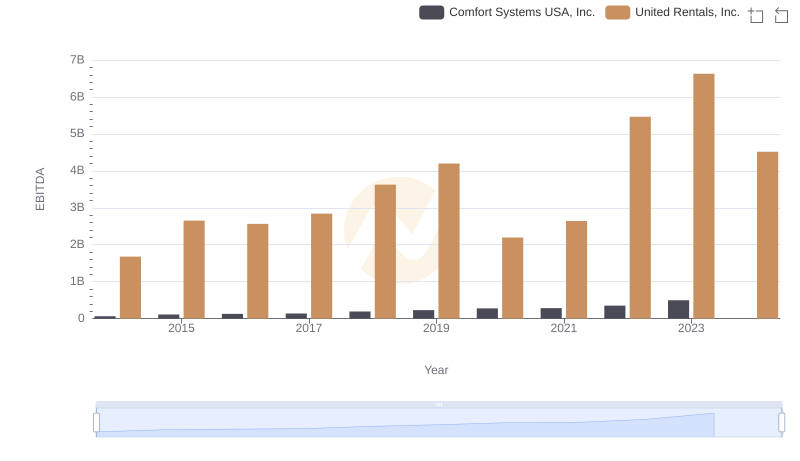
A Side-by-Side Analysis of EBITDA: United Rentals, Inc. and Comfort Systems USA, Inc.