| __timestamp | Builders FirstSource, Inc. | United Rentals, Inc. |
|---|---|---|
| Wednesday, January 1, 2014 | 356997000 | 2432000000 |
| Thursday, January 1, 2015 | 901458000 | 2480000000 |
| Friday, January 1, 2016 | 1596748000 | 2403000000 |
| Sunday, January 1, 2017 | 1727391000 | 2769000000 |
| Monday, January 1, 2018 | 1922940000 | 3364000000 |
| Tuesday, January 1, 2019 | 1976829000 | 3670000000 |
| Wednesday, January 1, 2020 | 2222584000 | 3183000000 |
| Friday, January 1, 2021 | 5850956000 | 3853000000 |
| Saturday, January 1, 2022 | 7744379000 | 4996000000 |
| Sunday, January 1, 2023 | 6012334000 | 5813000000 |
| Monday, January 1, 2024 | 6150000000 |
Cracking the code
In the ever-evolving landscape of the construction and rental industries, understanding financial trends is crucial. Over the past decade, United Rentals, Inc. and Builders FirstSource, Inc. have shown remarkable growth in their gross profits. From 2014 to 2023, Builders FirstSource, Inc. experienced a staggering increase of over 1,500% in gross profit, peaking in 2022. Meanwhile, United Rentals, Inc. demonstrated a steady upward trajectory, with a 140% rise, reaching its highest gross profit in 2023. Notably, Builders FirstSource, Inc. saw a significant surge in 2021, marking a pivotal year in its financial journey. However, data for 2024 is missing for Builders FirstSource, Inc., leaving room for speculation. These trends highlight the dynamic nature of these industries and the companies' strategic maneuvers to capitalize on market opportunities.
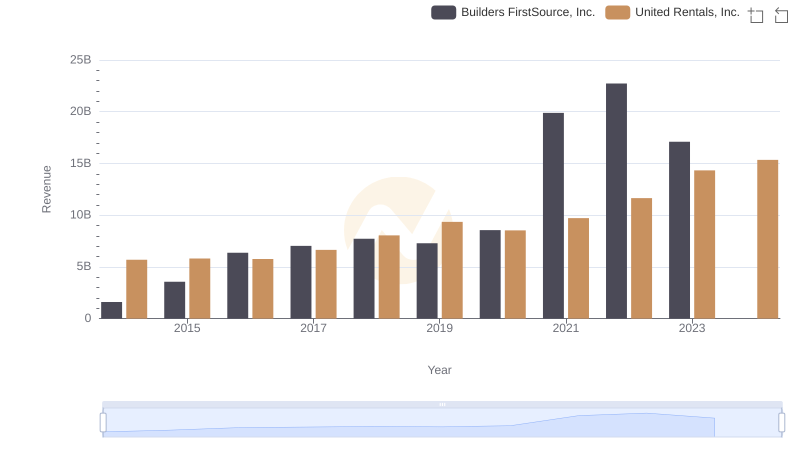
United Rentals, Inc. or Builders FirstSource, Inc.: Who Leads in Yearly Revenue?
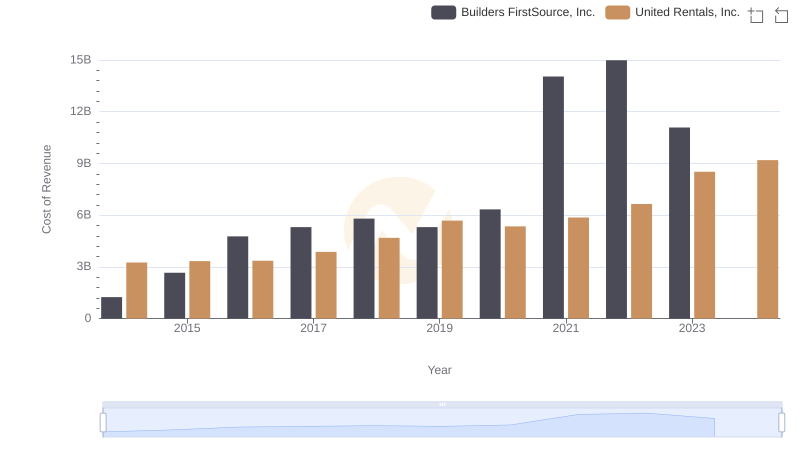
Cost Insights: Breaking Down United Rentals, Inc. and Builders FirstSource, Inc.'s Expenses
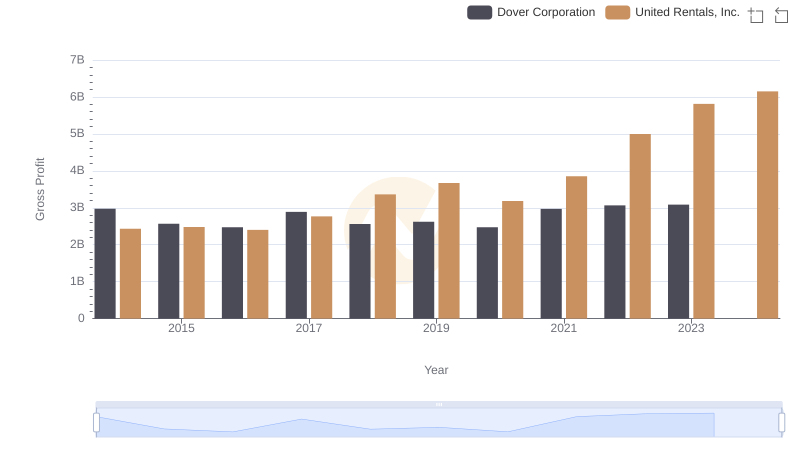
Gross Profit Trends Compared: United Rentals, Inc. vs Dover Corporation
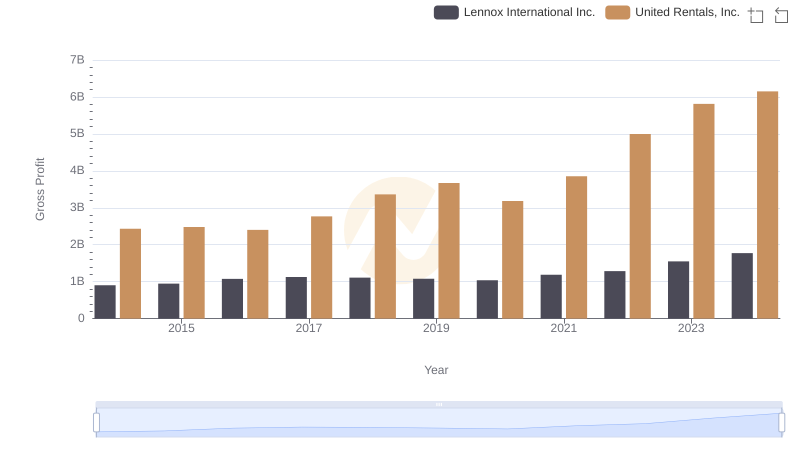
Gross Profit Comparison: United Rentals, Inc. and Lennox International Inc. Trends
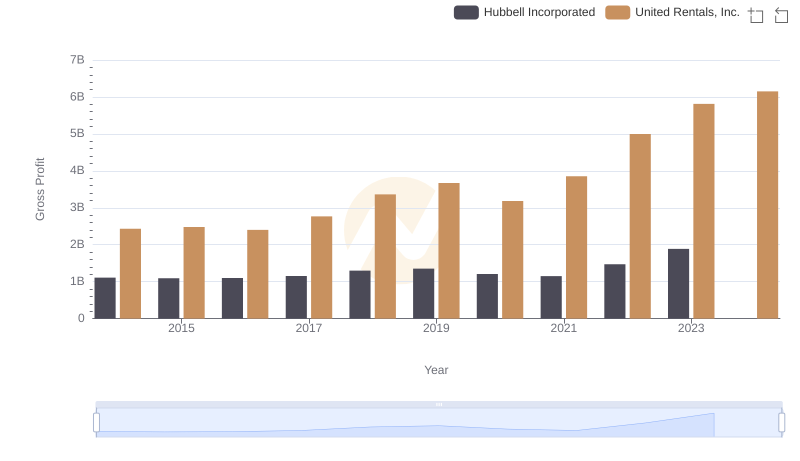
Who Generates Higher Gross Profit? United Rentals, Inc. or Hubbell Incorporated
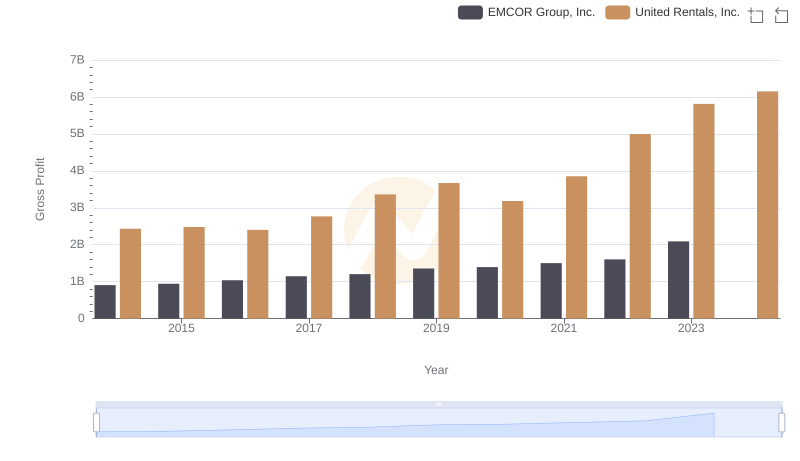
United Rentals, Inc. and EMCOR Group, Inc.: A Detailed Gross Profit Analysis
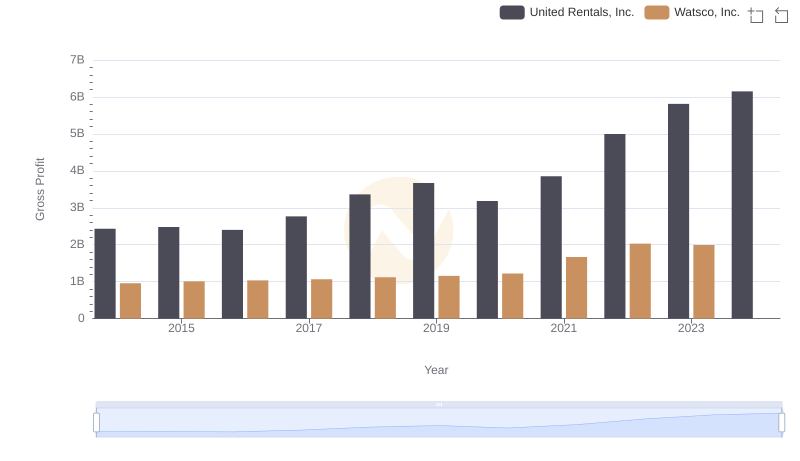
Gross Profit Analysis: Comparing United Rentals, Inc. and Watsco, Inc.
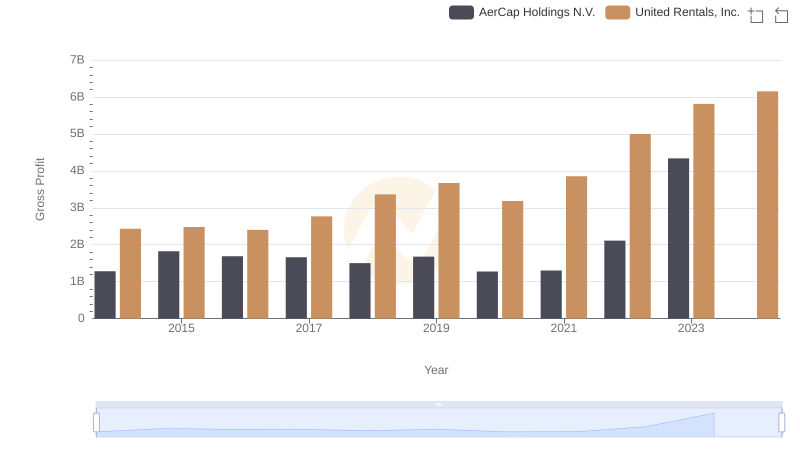
Gross Profit Analysis: Comparing United Rentals, Inc. and AerCap Holdings N.V.
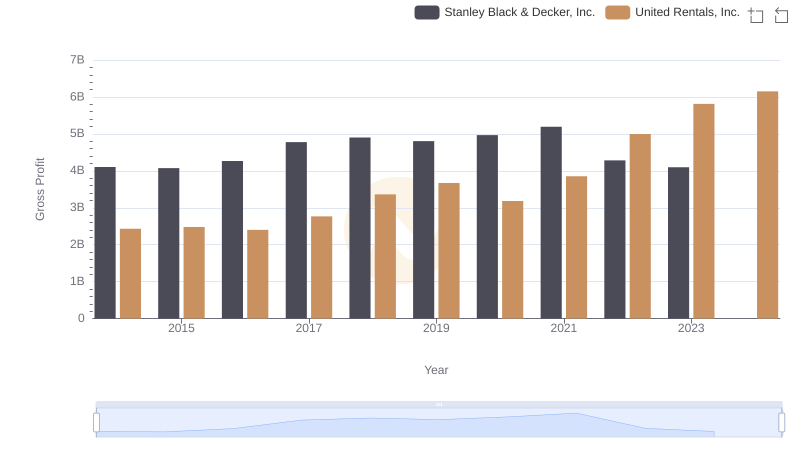
Gross Profit Analysis: Comparing United Rentals, Inc. and Stanley Black & Decker, Inc.
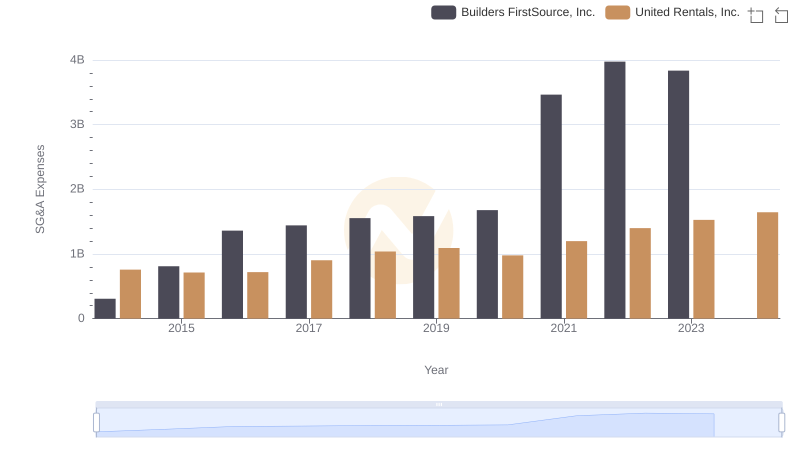
Who Optimizes SG&A Costs Better? United Rentals, Inc. or Builders FirstSource, Inc.
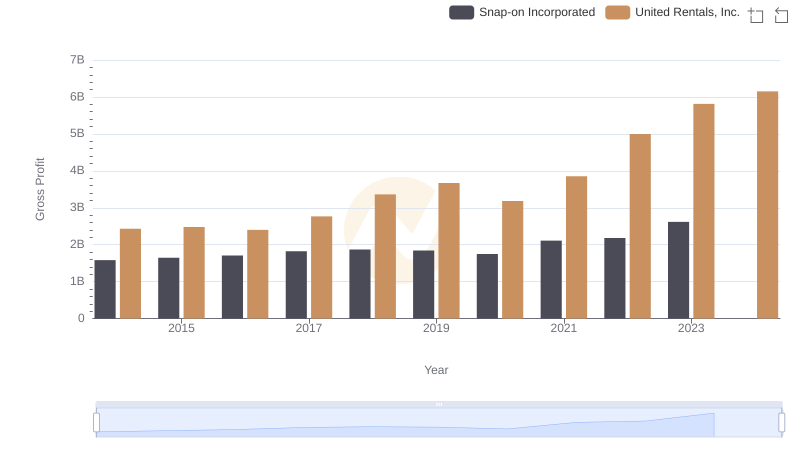
Gross Profit Analysis: Comparing United Rentals, Inc. and Snap-on Incorporated
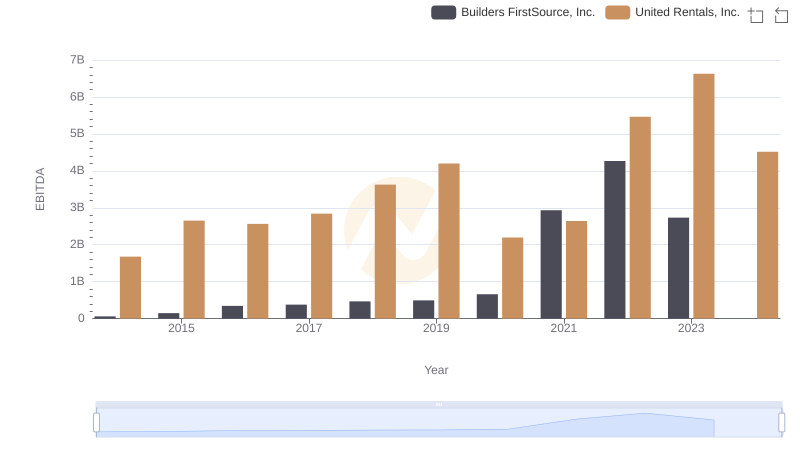
United Rentals, Inc. vs Builders FirstSource, Inc.: In-Depth EBITDA Performance Comparison