| __timestamp | IDEX Corporation | United Rentals, Inc. |
|---|---|---|
| Wednesday, January 1, 2014 | 504019000 | 1678000000 |
| Thursday, January 1, 2015 | 505071000 | 2653000000 |
| Friday, January 1, 2016 | 507871000 | 2566000000 |
| Sunday, January 1, 2017 | 591033000 | 2843000000 |
| Monday, January 1, 2018 | 657092000 | 3628000000 |
| Tuesday, January 1, 2019 | 647793000 | 4200000000 |
| Wednesday, January 1, 2020 | 604602000 | 2195000000 |
| Friday, January 1, 2021 | 720500000 | 2642000000 |
| Saturday, January 1, 2022 | 909800000 | 5464000000 |
| Sunday, January 1, 2023 | 964100000 | 6627000000 |
| Monday, January 1, 2024 | 677200000 | 4516000000 |
Data in motion
In the competitive landscape of industrial services, United Rentals, Inc. and IDEX Corporation have showcased remarkable EBITDA growth over the past decade. Since 2014, United Rentals has consistently outperformed, with a staggering 295% increase in EBITDA by 2023, peaking at $6.63 billion. This growth trajectory underscores its strategic expansions and robust market positioning.
Conversely, IDEX Corporation, while more modest in scale, has demonstrated a steady 91% growth in EBITDA, reaching $964 million in 2023. This reflects its resilience and adaptability in a dynamic market.
The data reveals a significant gap between the two companies, with United Rentals' EBITDA being approximately seven times larger than IDEX's in 2023. However, the absence of 2024 data for IDEX suggests potential volatility or strategic shifts. As the industrial sector evolves, these insights offer a glimpse into the financial health and strategic directions of these industry leaders.
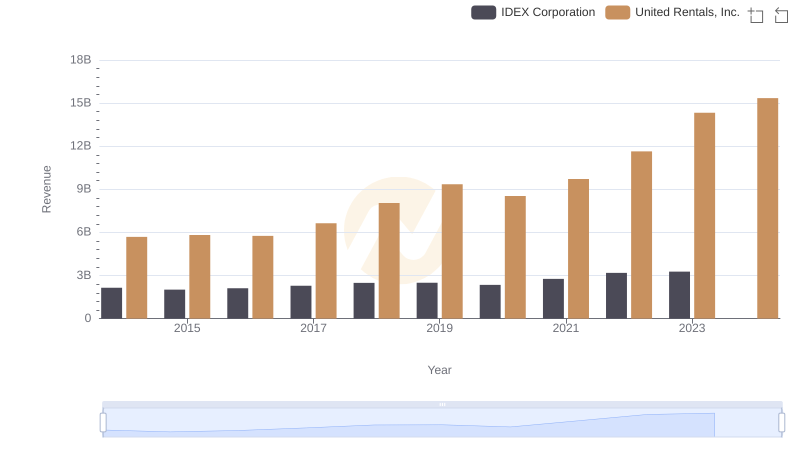
United Rentals, Inc. and IDEX Corporation: A Comprehensive Revenue Analysis
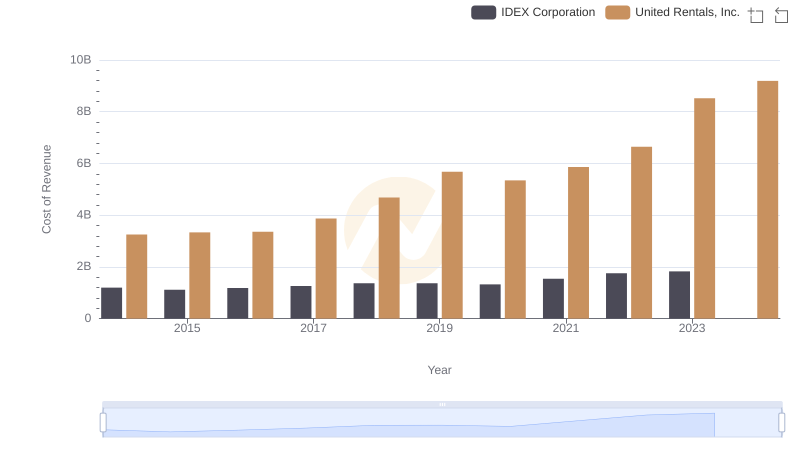
Analyzing Cost of Revenue: United Rentals, Inc. and IDEX Corporation
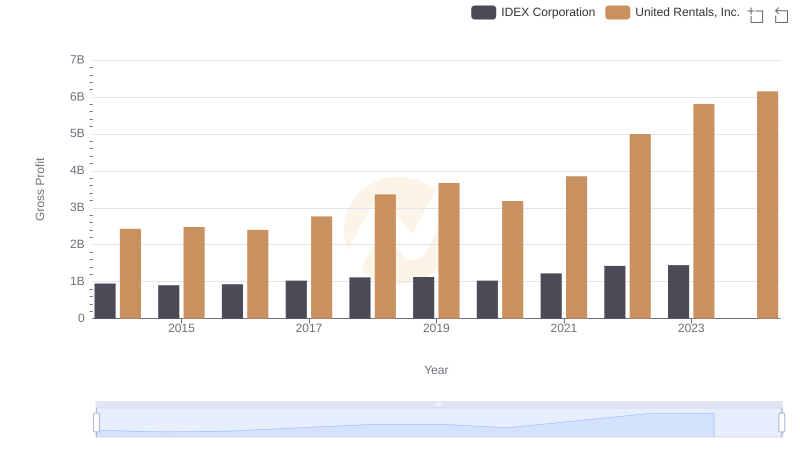
Gross Profit Analysis: Comparing United Rentals, Inc. and IDEX Corporation
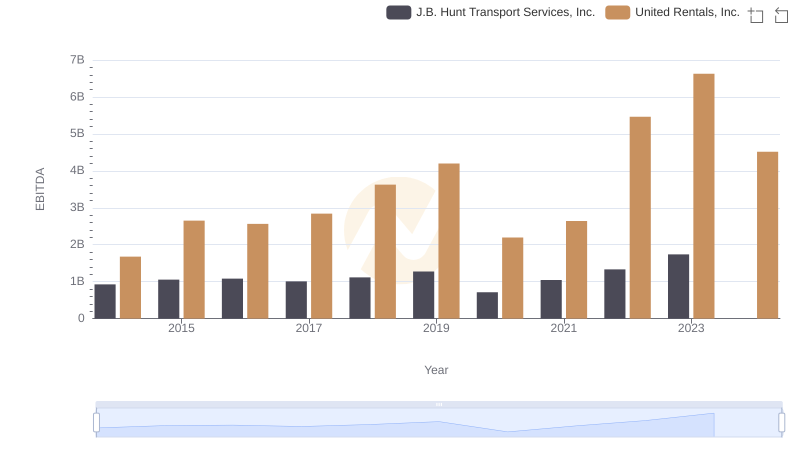
EBITDA Analysis: Evaluating United Rentals, Inc. Against J.B. Hunt Transport Services, Inc.
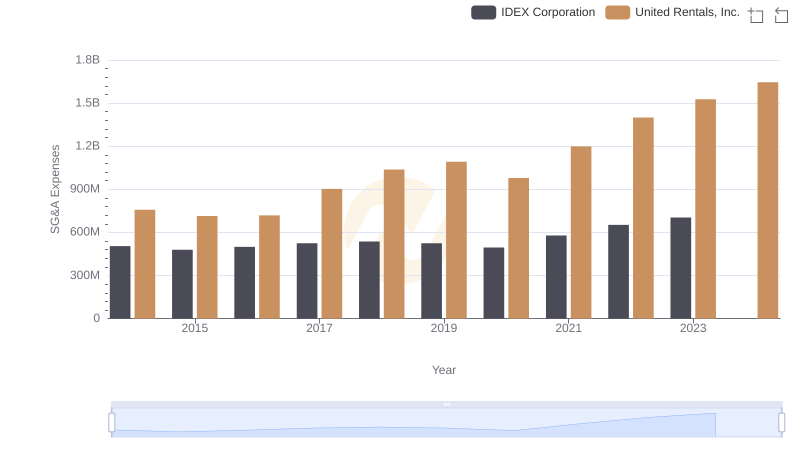
United Rentals, Inc. and IDEX Corporation: SG&A Spending Patterns Compared
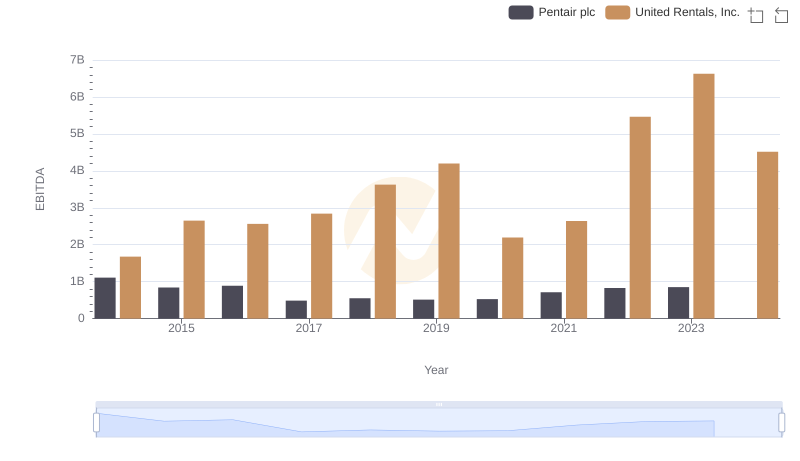
Comprehensive EBITDA Comparison: United Rentals, Inc. vs Pentair plc
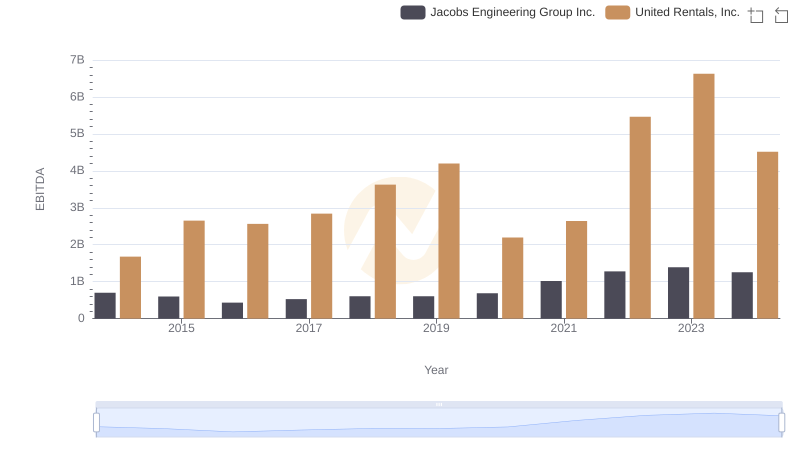
EBITDA Performance Review: United Rentals, Inc. vs Jacobs Engineering Group Inc.
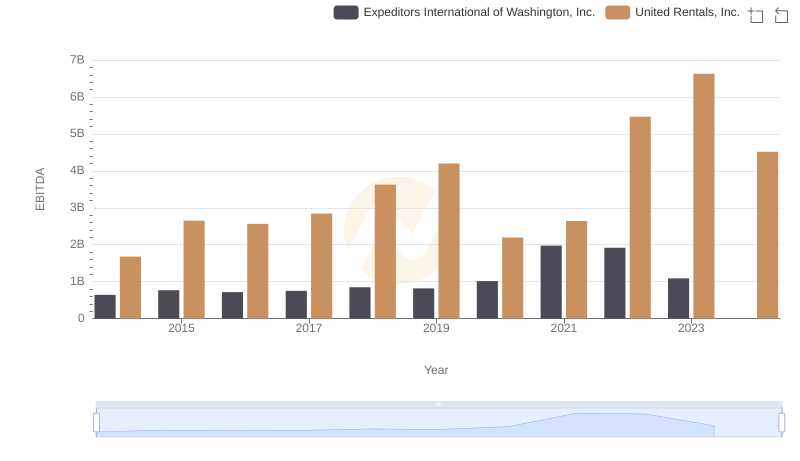
A Side-by-Side Analysis of EBITDA: United Rentals, Inc. and Expeditors International of Washington, Inc.

United Rentals, Inc. vs Owens Corning: In-Depth EBITDA Performance Comparison
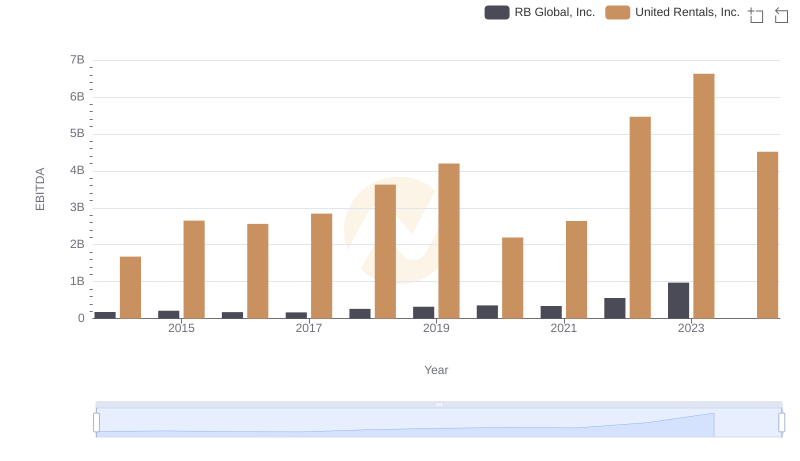
Comprehensive EBITDA Comparison: United Rentals, Inc. vs RB Global, Inc.
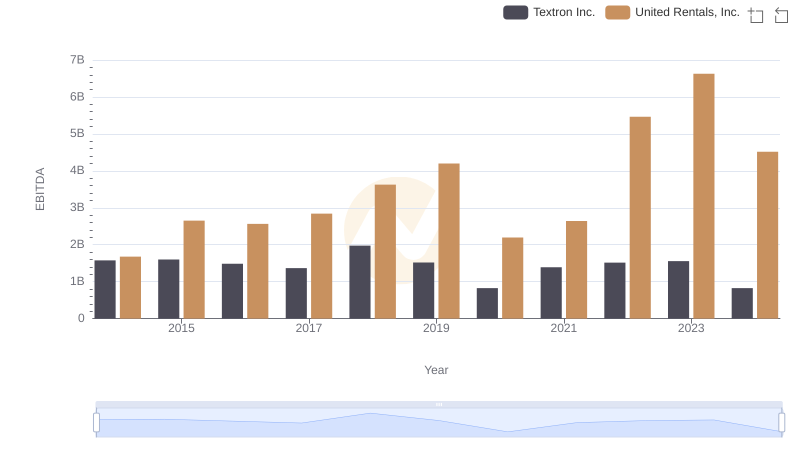
United Rentals, Inc. vs Textron Inc.: In-Depth EBITDA Performance Comparison