| __timestamp | Southwest Airlines Co. | United Rentals, Inc. |
|---|---|---|
| Wednesday, January 1, 2014 | 207000000 | 758000000 |
| Thursday, January 1, 2015 | 218000000 | 714000000 |
| Friday, January 1, 2016 | 2703000000 | 719000000 |
| Sunday, January 1, 2017 | 2847000000 | 903000000 |
| Monday, January 1, 2018 | 2852000000 | 1038000000 |
| Tuesday, January 1, 2019 | 3026000000 | 1092000000 |
| Wednesday, January 1, 2020 | 1926000000 | 979000000 |
| Friday, January 1, 2021 | 2388000000 | 1199000000 |
| Saturday, January 1, 2022 | 3735000000 | 1400000000 |
| Sunday, January 1, 2023 | 3992000000 | 1527000000 |
| Monday, January 1, 2024 | 0 | 1645000000 |
Unleashing insights
In the ever-evolving landscape of corporate finance, effective cost management is paramount. This analysis delves into the Selling, General, and Administrative (SG&A) expenses of two industry titans: United Rentals, Inc. and Southwest Airlines Co., from 2014 to 2023.
Southwest Airlines Co. has seen a remarkable 1,830% increase in SG&A expenses, peaking in 2023. This surge reflects strategic investments and operational expansions. Conversely, United Rentals, Inc. experienced a steady 114% rise, indicating a more controlled cost strategy.
The data reveals a fascinating divergence in cost management approaches. While Southwest Airlines navigates the skies with aggressive growth, United Rentals anchors its strategy in stability. This comparison offers invaluable insights into how different sectors manage their financial sails amidst economic tides.
As we look to the future, understanding these trends will be crucial for stakeholders aiming to optimize their financial strategies.
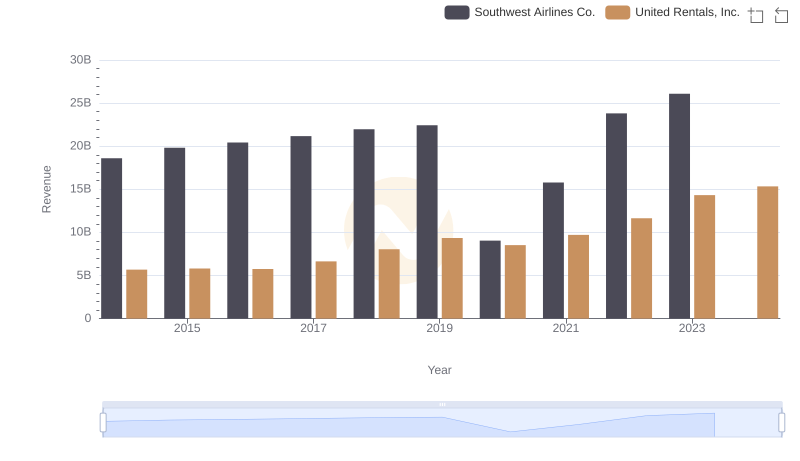
Comparing Revenue Performance: United Rentals, Inc. or Southwest Airlines Co.?
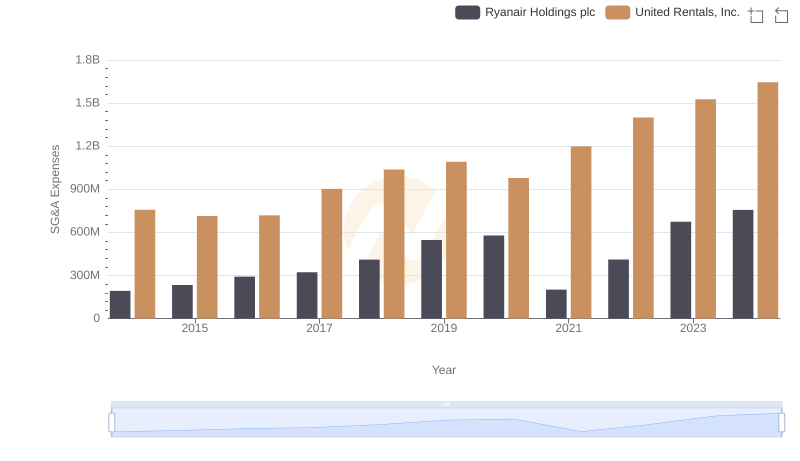
Breaking Down SG&A Expenses: United Rentals, Inc. vs Ryanair Holdings plc
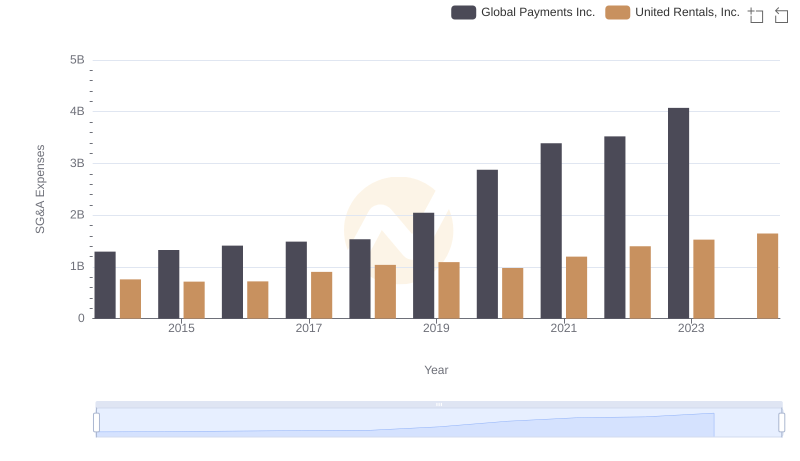
United Rentals, Inc. and Global Payments Inc.: SG&A Spending Patterns Compared
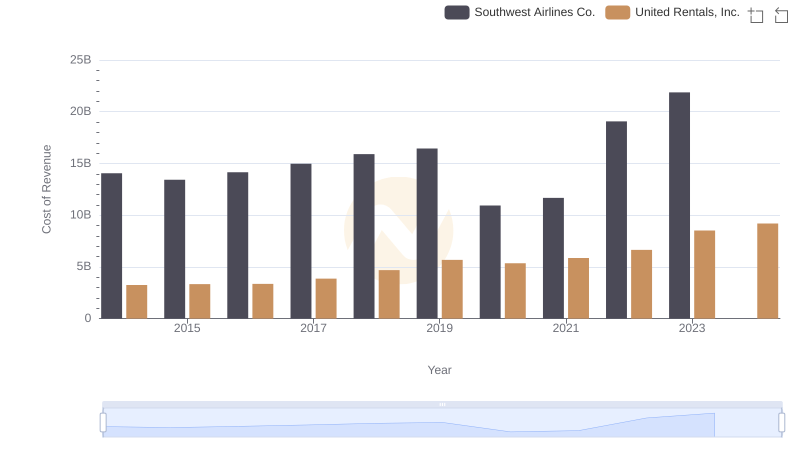
Cost Insights: Breaking Down United Rentals, Inc. and Southwest Airlines Co.'s Expenses
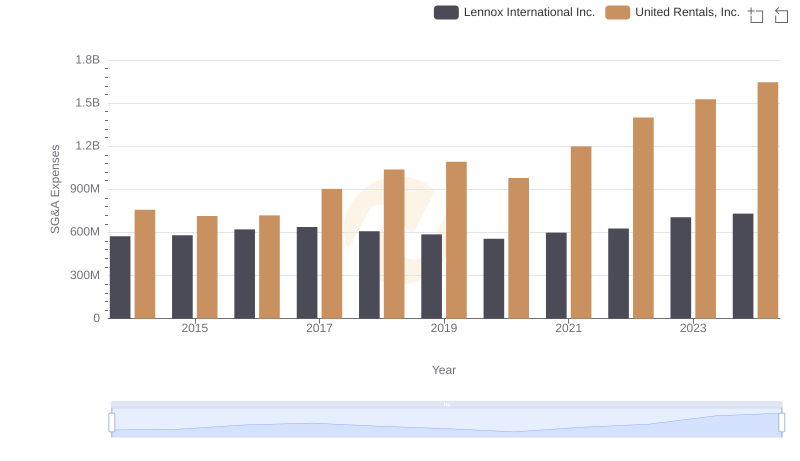
United Rentals, Inc. and Lennox International Inc.: SG&A Spending Patterns Compared
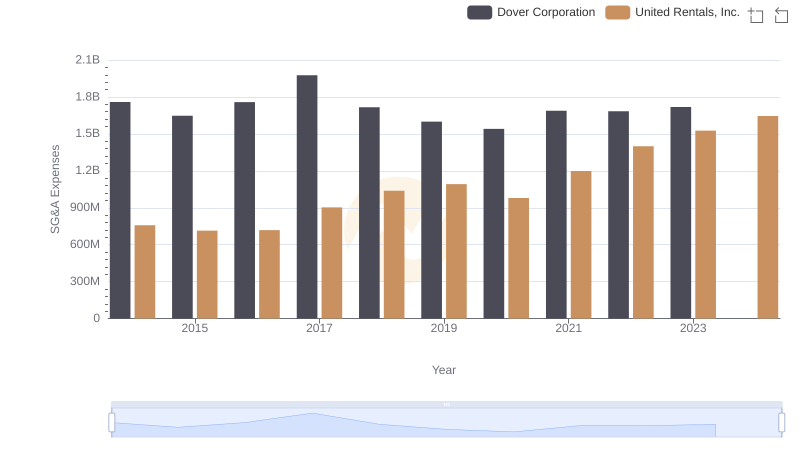
Operational Costs Compared: SG&A Analysis of United Rentals, Inc. and Dover Corporation
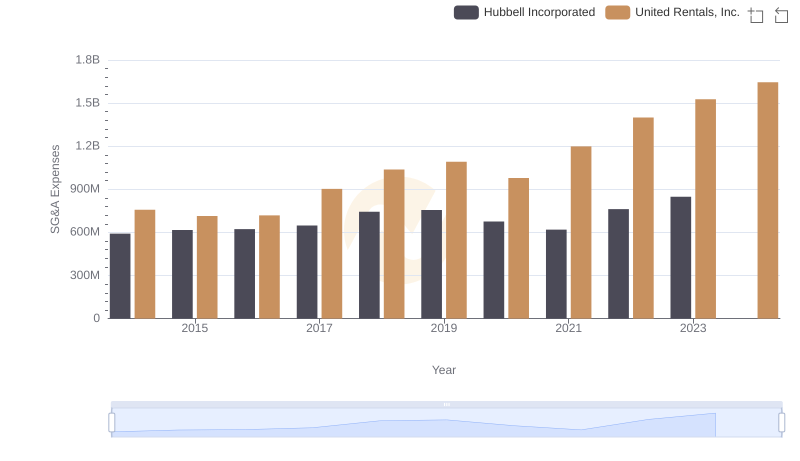
Who Optimizes SG&A Costs Better? United Rentals, Inc. or Hubbell Incorporated
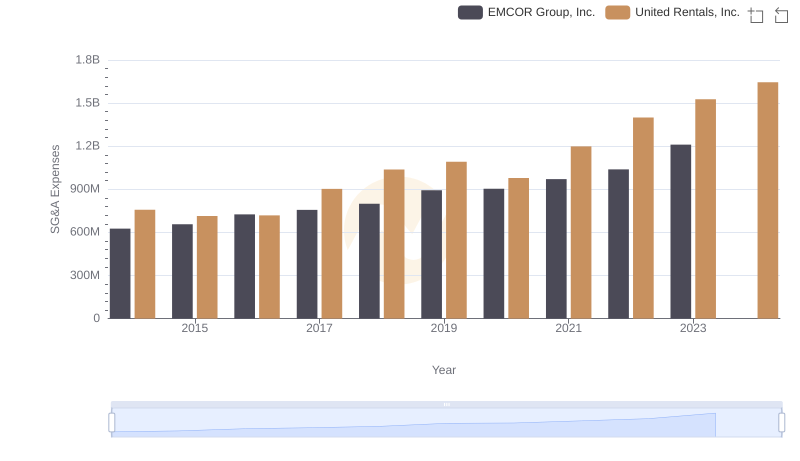
SG&A Efficiency Analysis: Comparing United Rentals, Inc. and EMCOR Group, Inc.
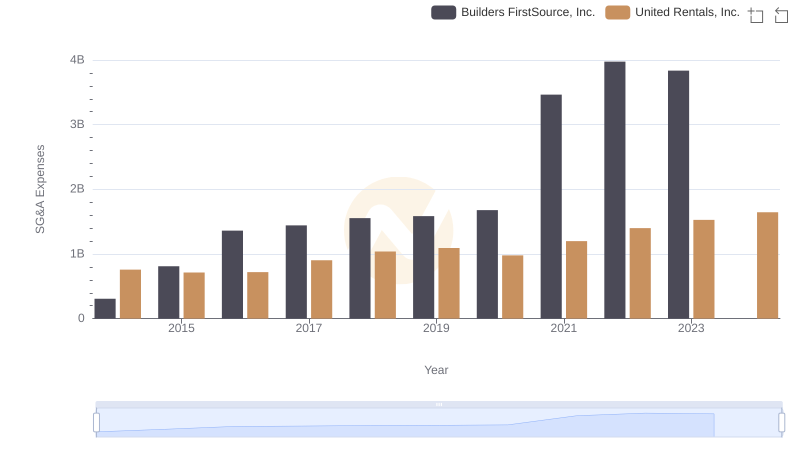
Who Optimizes SG&A Costs Better? United Rentals, Inc. or Builders FirstSource, Inc.
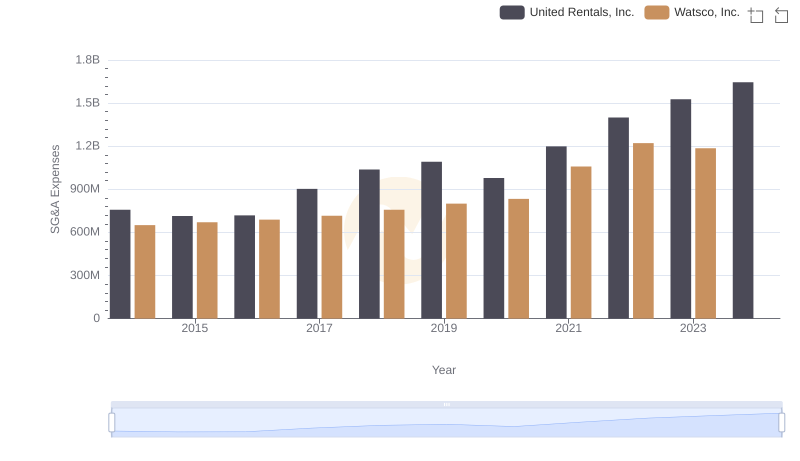
Cost Management Insights: SG&A Expenses for United Rentals, Inc. and Watsco, Inc.
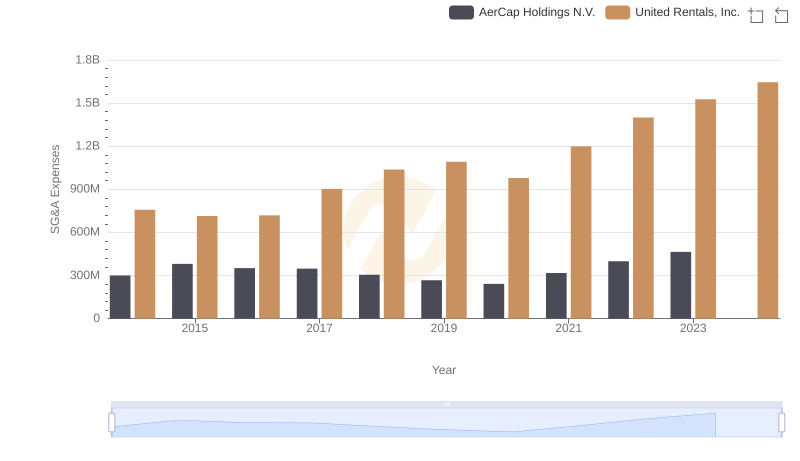
Cost Management Insights: SG&A Expenses for United Rentals, Inc. and AerCap Holdings N.V.
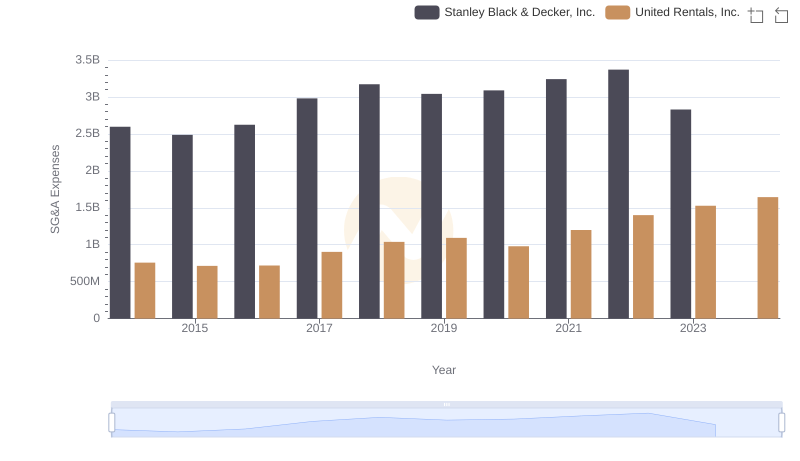
Selling, General, and Administrative Costs: United Rentals, Inc. vs Stanley Black & Decker, Inc.