| __timestamp | Rockwell Automation, Inc. | United Rentals, Inc. |
|---|---|---|
| Wednesday, January 1, 2014 | 1570100000 | 758000000 |
| Thursday, January 1, 2015 | 1506400000 | 714000000 |
| Friday, January 1, 2016 | 1467400000 | 719000000 |
| Sunday, January 1, 2017 | 1591500000 | 903000000 |
| Monday, January 1, 2018 | 1599000000 | 1038000000 |
| Tuesday, January 1, 2019 | 1538500000 | 1092000000 |
| Wednesday, January 1, 2020 | 1479800000 | 979000000 |
| Friday, January 1, 2021 | 1680000000 | 1199000000 |
| Saturday, January 1, 2022 | 1766700000 | 1400000000 |
| Sunday, January 1, 2023 | 2023700000 | 1527000000 |
| Monday, January 1, 2024 | 2002600000 | 1645000000 |
Data in motion
In the ever-evolving landscape of industrial giants, understanding the financial dynamics is crucial. Over the past decade, from 2014 to 2024, United Rentals, Inc. and Rockwell Automation, Inc. have showcased intriguing trends in their Selling, General, and Administrative (SG&A) expenses. Rockwell Automation's SG&A expenses have seen a steady increase, peaking in 2023 with a 29% rise from 2014. Meanwhile, United Rentals has demonstrated a more dramatic growth, with their SG&A expenses more than doubling, reflecting a 117% increase over the same period. This divergence highlights differing strategic priorities and operational scales. As we look towards 2024, both companies continue to invest heavily in their administrative capabilities, signaling robust growth strategies. These trends not only reflect their internal efficiencies but also their adaptability in a competitive market.

Annual Revenue Comparison: United Rentals, Inc. vs Rockwell Automation, Inc.
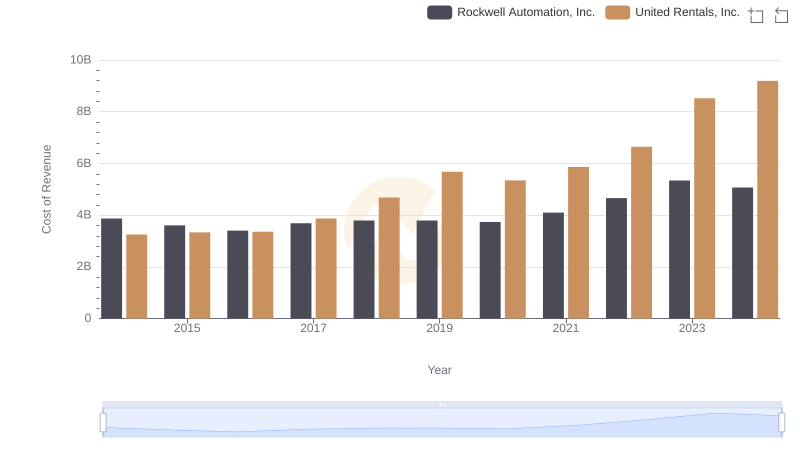
Cost of Revenue Comparison: United Rentals, Inc. vs Rockwell Automation, Inc.
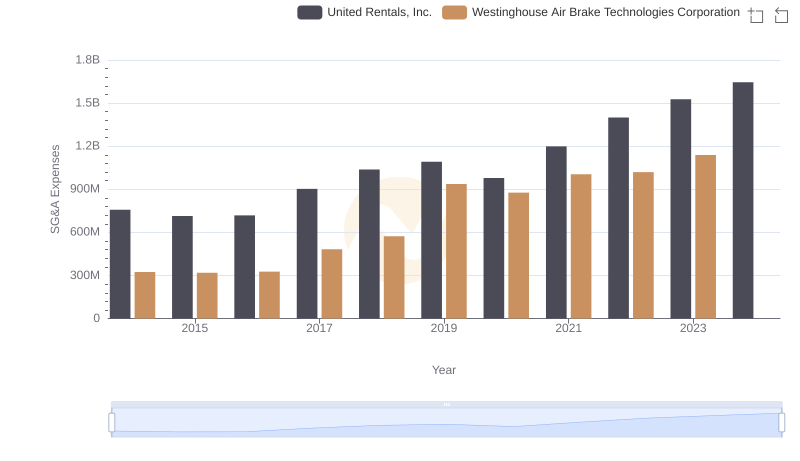
Cost Management Insights: SG&A Expenses for United Rentals, Inc. and Westinghouse Air Brake Technologies Corporation
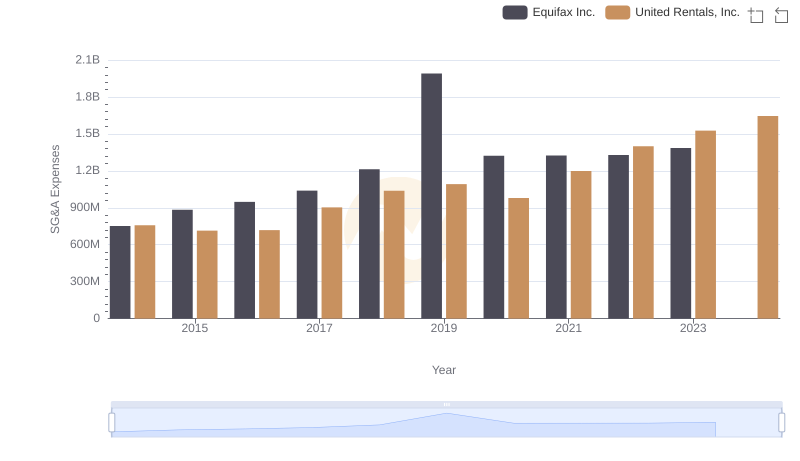
United Rentals, Inc. vs Equifax Inc.: SG&A Expense Trends
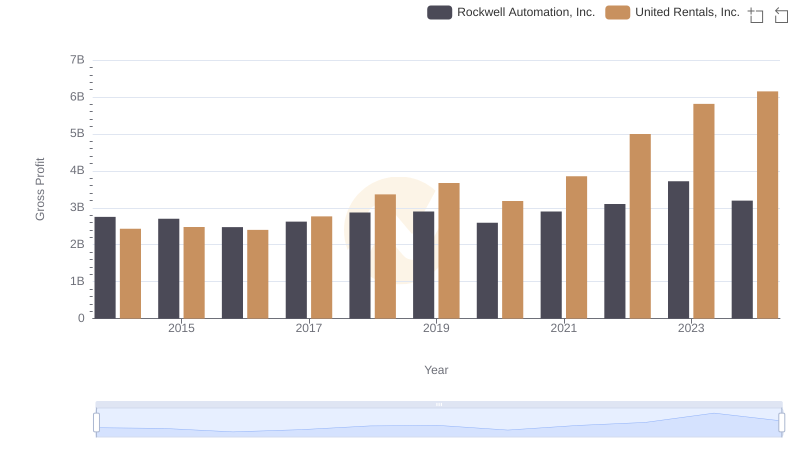
Who Generates Higher Gross Profit? United Rentals, Inc. or Rockwell Automation, Inc.
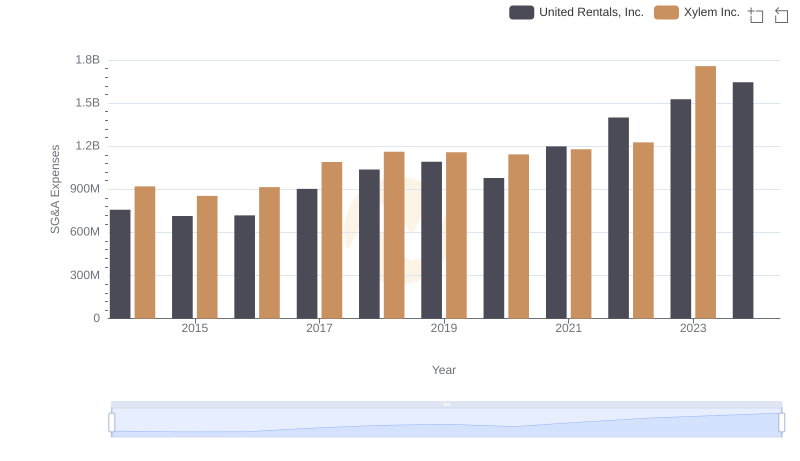
United Rentals, Inc. and Xylem Inc.: SG&A Spending Patterns Compared
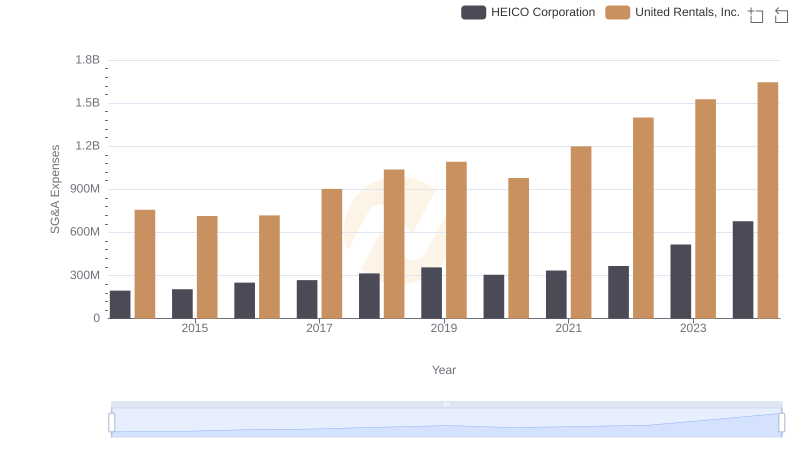
United Rentals, Inc. vs HEICO Corporation: SG&A Expense Trends
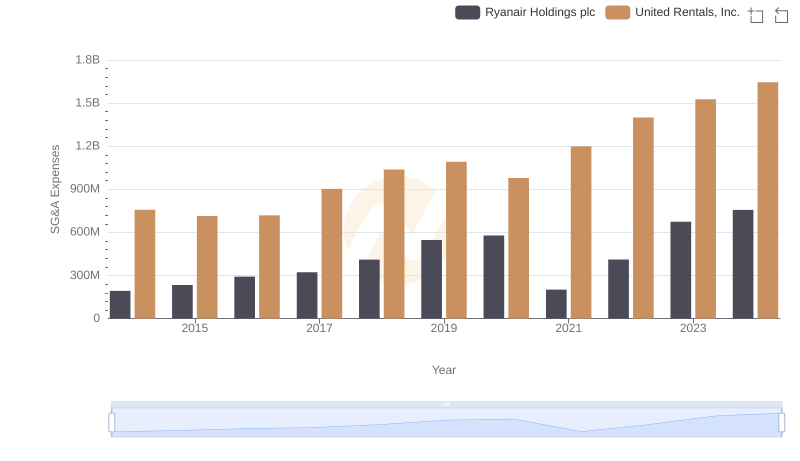
Breaking Down SG&A Expenses: United Rentals, Inc. vs Ryanair Holdings plc
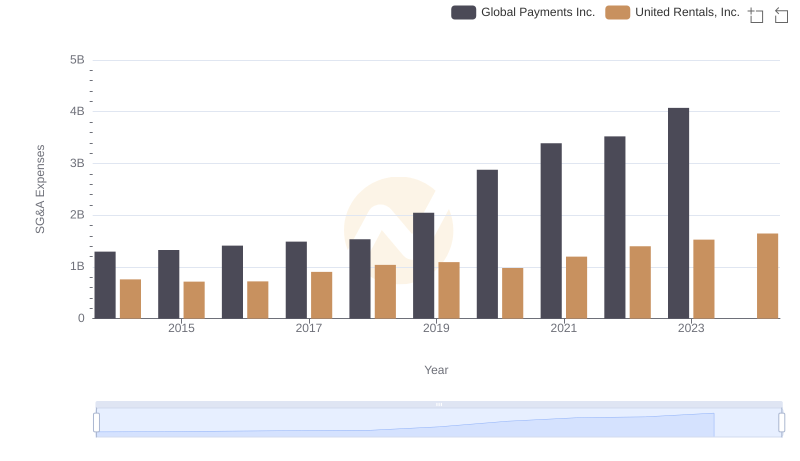
United Rentals, Inc. and Global Payments Inc.: SG&A Spending Patterns Compared
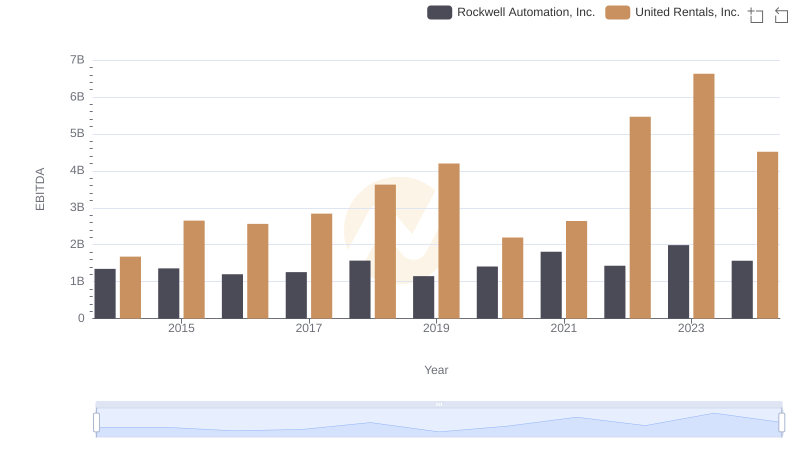
EBITDA Metrics Evaluated: United Rentals, Inc. vs Rockwell Automation, Inc.
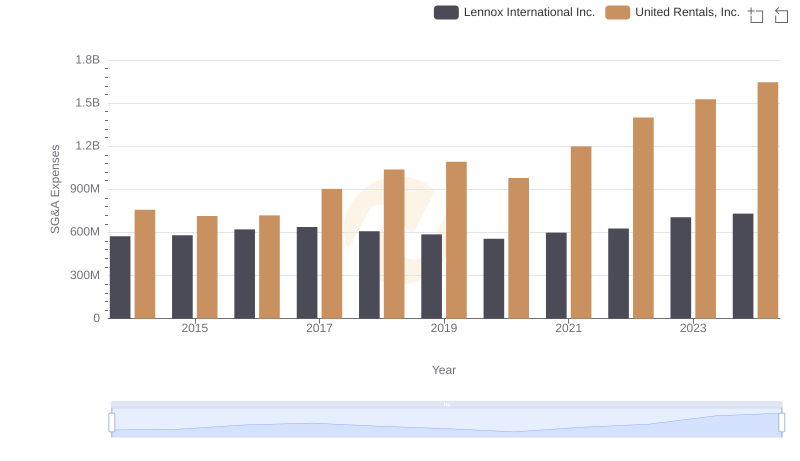
United Rentals, Inc. and Lennox International Inc.: SG&A Spending Patterns Compared
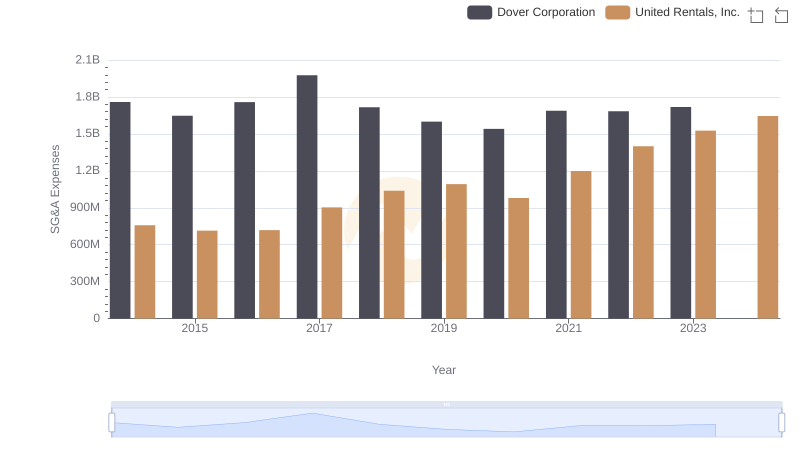
Operational Costs Compared: SG&A Analysis of United Rentals, Inc. and Dover Corporation