| __timestamp | HEICO Corporation | United Rentals, Inc. |
|---|---|---|
| Wednesday, January 1, 2014 | 194924000 | 758000000 |
| Thursday, January 1, 2015 | 204523000 | 714000000 |
| Friday, January 1, 2016 | 250147000 | 719000000 |
| Sunday, January 1, 2017 | 268067000 | 903000000 |
| Monday, January 1, 2018 | 314470000 | 1038000000 |
| Tuesday, January 1, 2019 | 356743000 | 1092000000 |
| Wednesday, January 1, 2020 | 305479000 | 979000000 |
| Friday, January 1, 2021 | 334523000 | 1199000000 |
| Saturday, January 1, 2022 | 365915000 | 1400000000 |
| Sunday, January 1, 2023 | 516292000 | 1527000000 |
| Monday, January 1, 2024 | 677271000 | 1645000000 |
Cracking the code
In the ever-evolving landscape of corporate finance, understanding the trends in Selling, General, and Administrative (SG&A) expenses is crucial for investors and analysts alike. Over the past decade, United Rentals, Inc. and HEICO Corporation have showcased distinct trajectories in their SG&A expenditures.
From 2014 to 2024, United Rentals, Inc. has seen a steady increase in SG&A expenses, growing by approximately 117%. This reflects the company's aggressive expansion and strategic investments. In contrast, HEICO Corporation's SG&A expenses have surged by nearly 247% during the same period, indicating a robust growth strategy in the aerospace and electronics sectors.
By 2024, United Rentals, Inc.'s SG&A expenses are projected to reach 1.65 billion, while HEICO Corporation's will approach 678 million. This data underscores the differing scales and strategies of these industry giants, offering valuable insights for stakeholders.
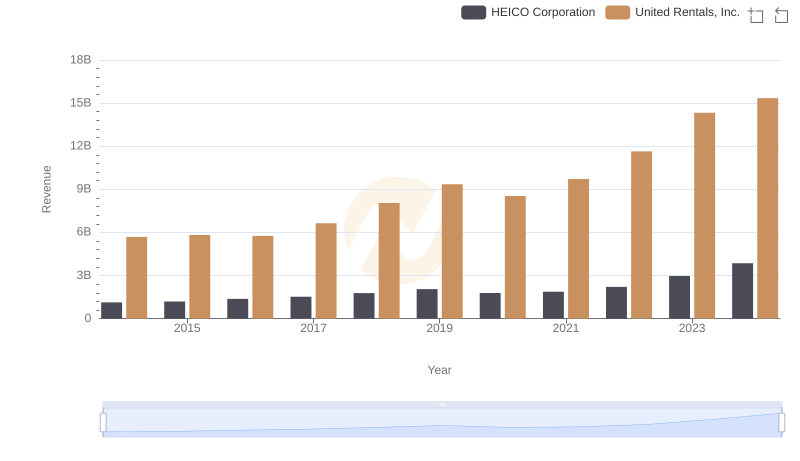
Who Generates More Revenue? United Rentals, Inc. or HEICO Corporation
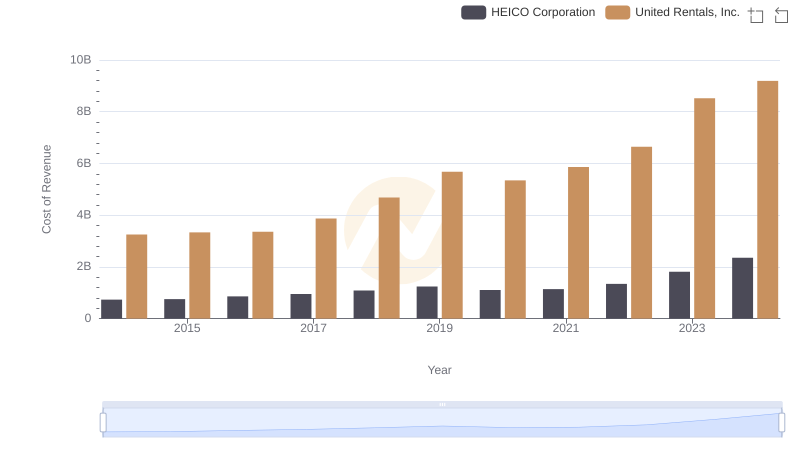
United Rentals, Inc. vs HEICO Corporation: Efficiency in Cost of Revenue Explored
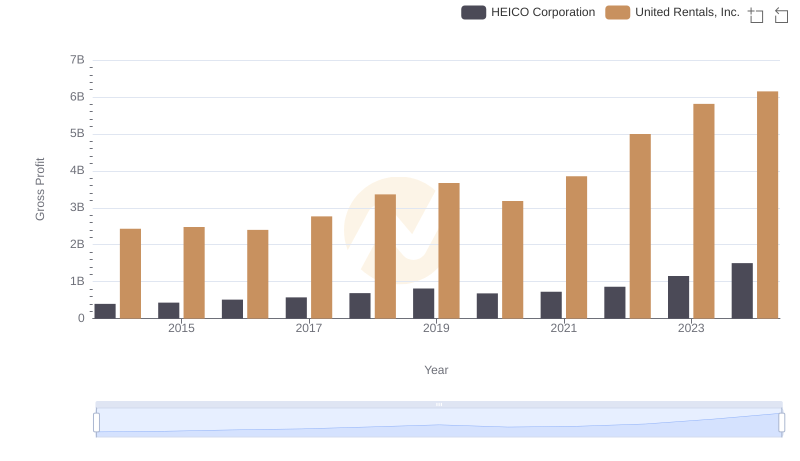
Who Generates Higher Gross Profit? United Rentals, Inc. or HEICO Corporation
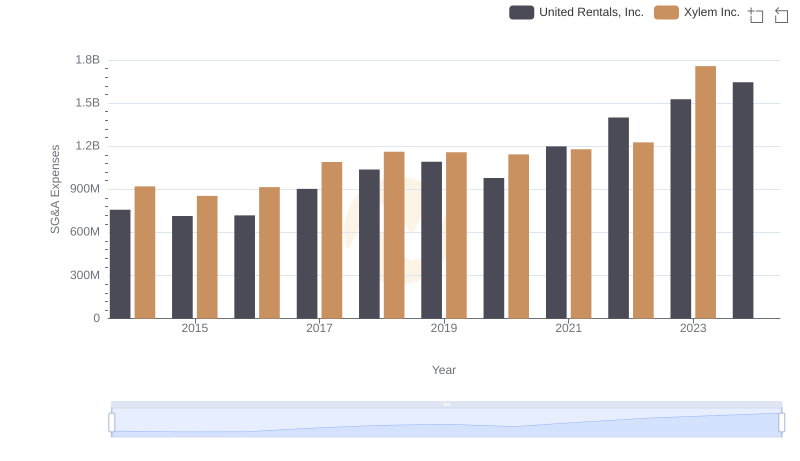
United Rentals, Inc. and Xylem Inc.: SG&A Spending Patterns Compared
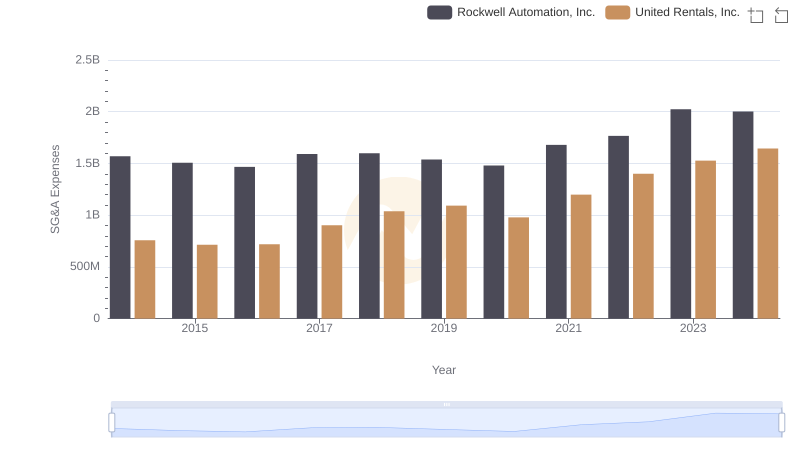
United Rentals, Inc. vs Rockwell Automation, Inc.: SG&A Expense Trends
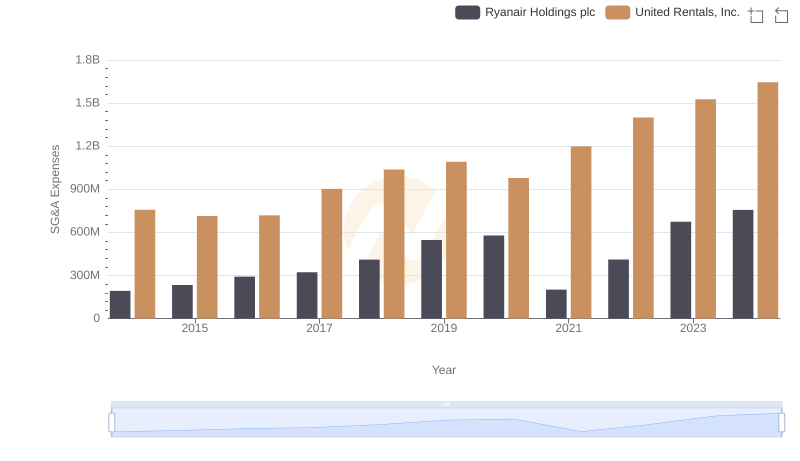
Breaking Down SG&A Expenses: United Rentals, Inc. vs Ryanair Holdings plc
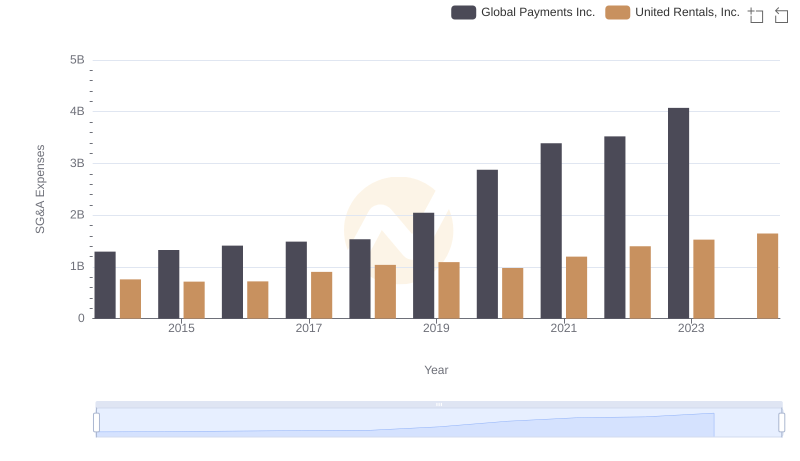
United Rentals, Inc. and Global Payments Inc.: SG&A Spending Patterns Compared
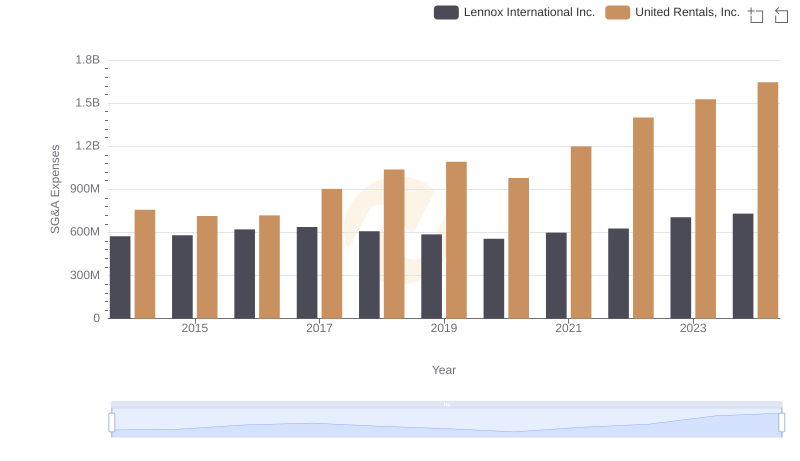
United Rentals, Inc. and Lennox International Inc.: SG&A Spending Patterns Compared
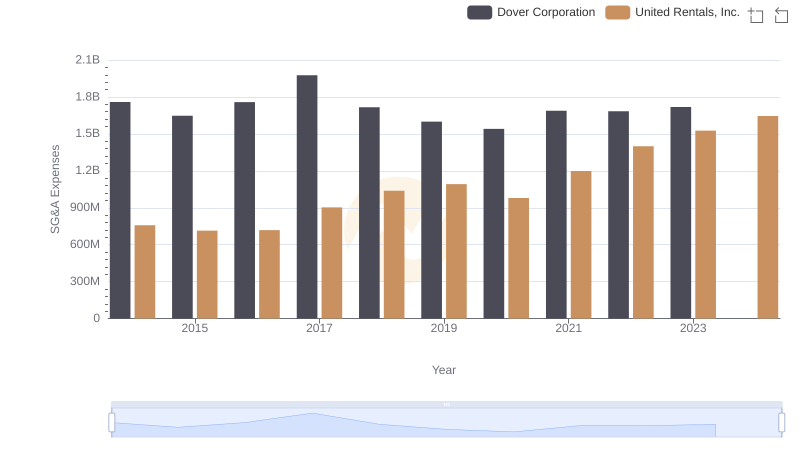
Operational Costs Compared: SG&A Analysis of United Rentals, Inc. and Dover Corporation
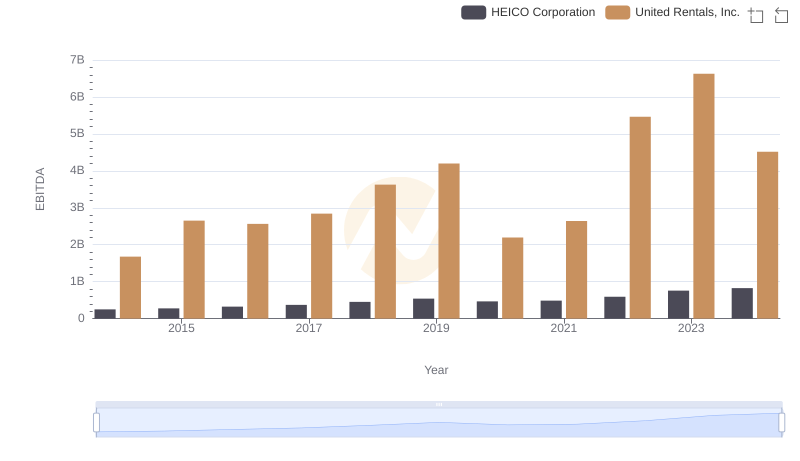
United Rentals, Inc. vs HEICO Corporation: In-Depth EBITDA Performance Comparison
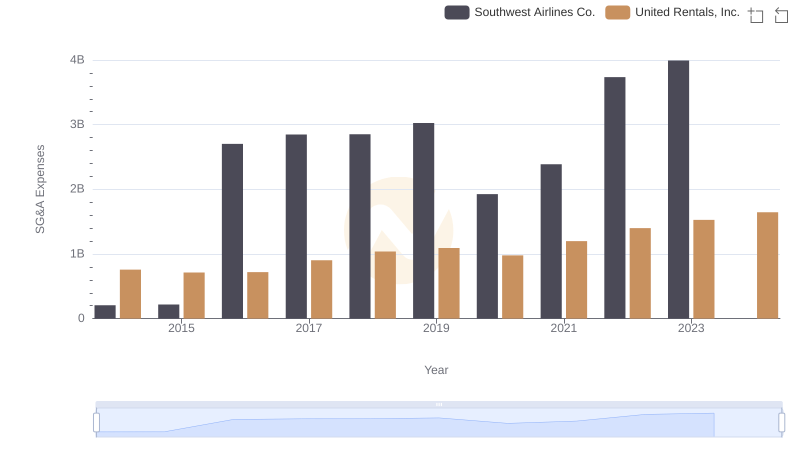
Cost Management Insights: SG&A Expenses for United Rentals, Inc. and Southwest Airlines Co.
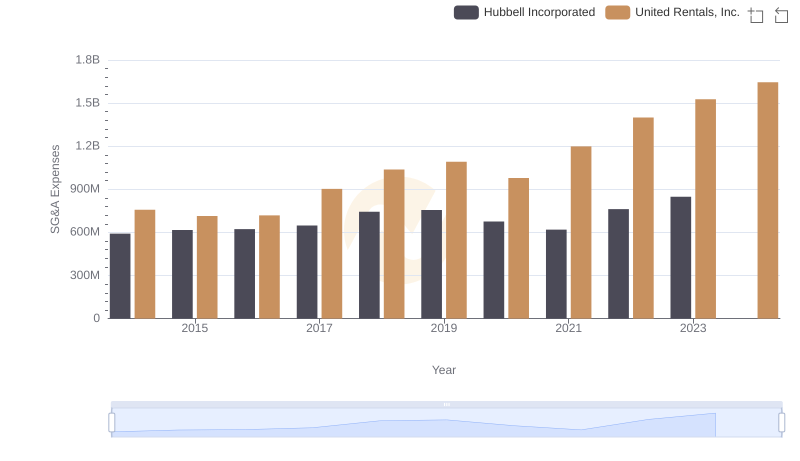
Who Optimizes SG&A Costs Better? United Rentals, Inc. or Hubbell Incorporated