| __timestamp | Dover Corporation | United Rentals, Inc. |
|---|---|---|
| Wednesday, January 1, 2014 | 1758765000 | 758000000 |
| Thursday, January 1, 2015 | 1647382000 | 714000000 |
| Friday, January 1, 2016 | 1757523000 | 719000000 |
| Sunday, January 1, 2017 | 1975932000 | 903000000 |
| Monday, January 1, 2018 | 1716444000 | 1038000000 |
| Tuesday, January 1, 2019 | 1599098000 | 1092000000 |
| Wednesday, January 1, 2020 | 1541032000 | 979000000 |
| Friday, January 1, 2021 | 1688278000 | 1199000000 |
| Saturday, January 1, 2022 | 1684226000 | 1400000000 |
| Sunday, January 1, 2023 | 1718290000 | 1527000000 |
| Monday, January 1, 2024 | 1752266000 | 1645000000 |
Infusing magic into the data realm
In the ever-evolving landscape of corporate finance, understanding operational costs is crucial. This analysis delves into the Selling, General, and Administrative (SG&A) expenses of United Rentals, Inc. and Dover Corporation from 2014 to 2023. Over this decade, Dover Corporation consistently reported higher SG&A expenses, peaking in 2017 with a 13% increase from 2016. Meanwhile, United Rentals showcased a remarkable upward trend, with a 115% rise in SG&A expenses from 2014 to 2023, reflecting its aggressive growth strategy. Notably, 2023 marked a significant year for United Rentals, as its SG&A expenses approached those of Dover Corporation, highlighting its expanding market presence. This data underscores the strategic financial maneuvers of both companies, offering insights into their operational priorities and market positioning.

United Rentals, Inc. or Dover Corporation: Who Leads in Yearly Revenue?
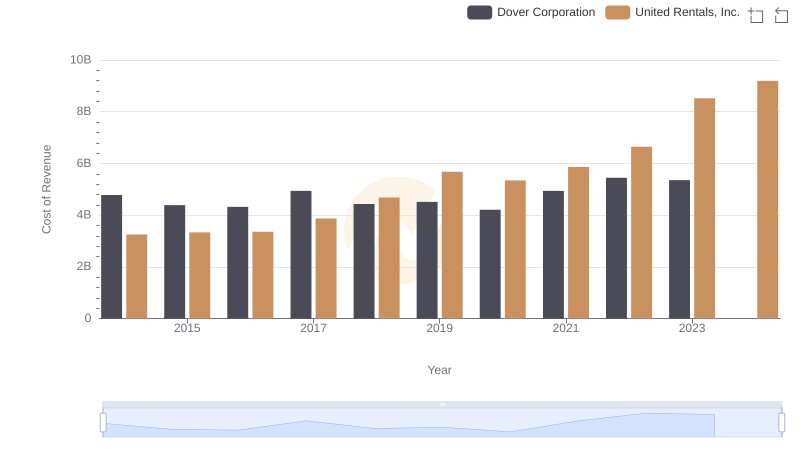
Cost Insights: Breaking Down United Rentals, Inc. and Dover Corporation's Expenses
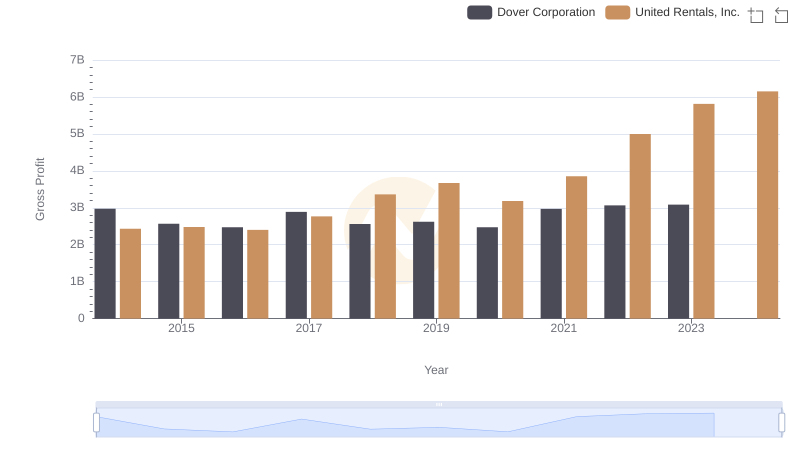
Gross Profit Trends Compared: United Rentals, Inc. vs Dover Corporation
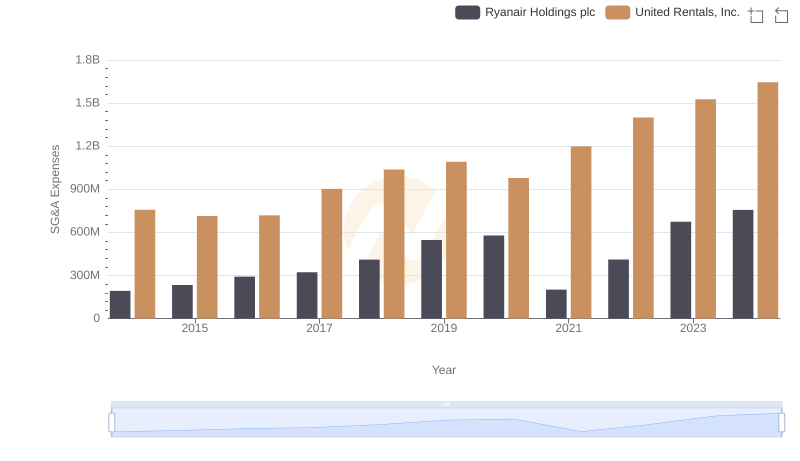
Breaking Down SG&A Expenses: United Rentals, Inc. vs Ryanair Holdings plc
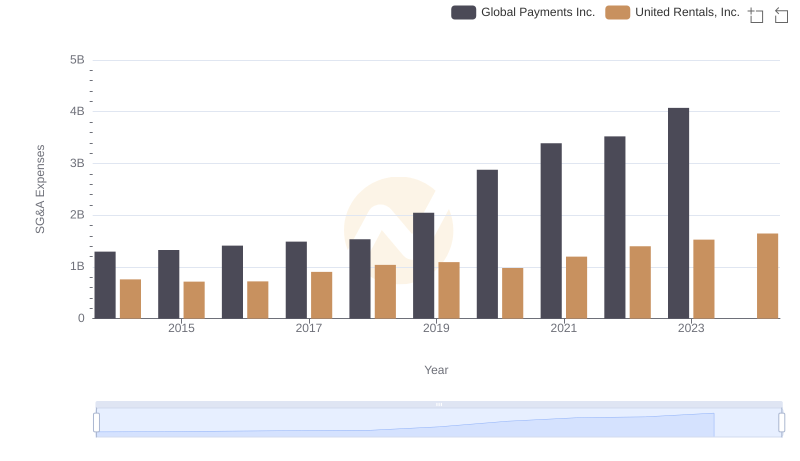
United Rentals, Inc. and Global Payments Inc.: SG&A Spending Patterns Compared
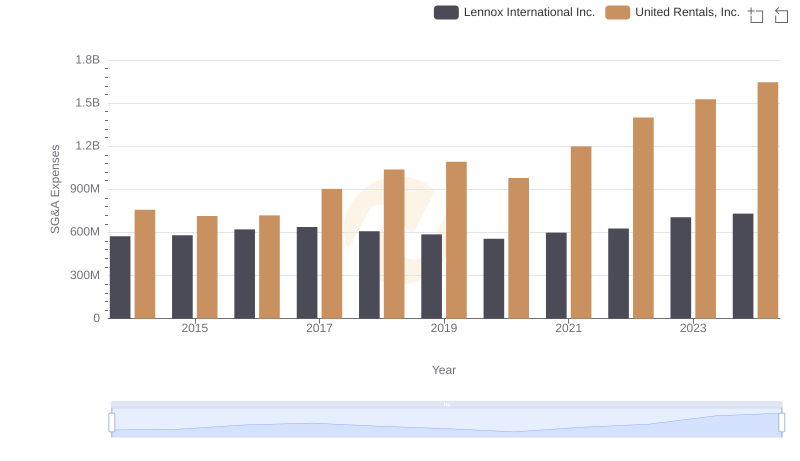
United Rentals, Inc. and Lennox International Inc.: SG&A Spending Patterns Compared
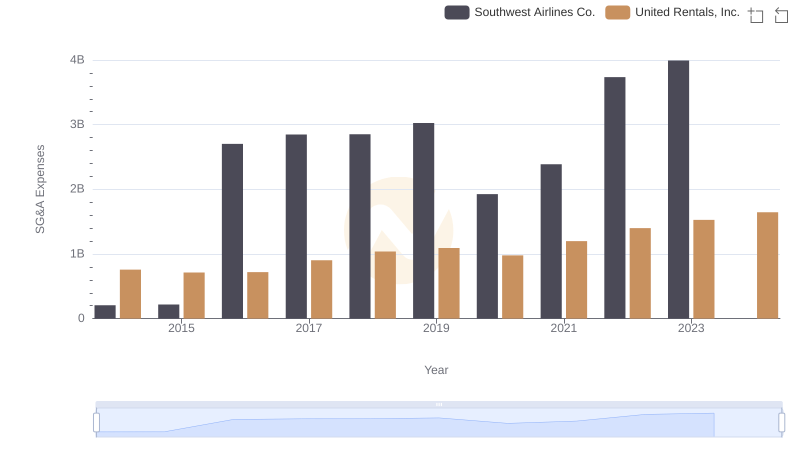
Cost Management Insights: SG&A Expenses for United Rentals, Inc. and Southwest Airlines Co.
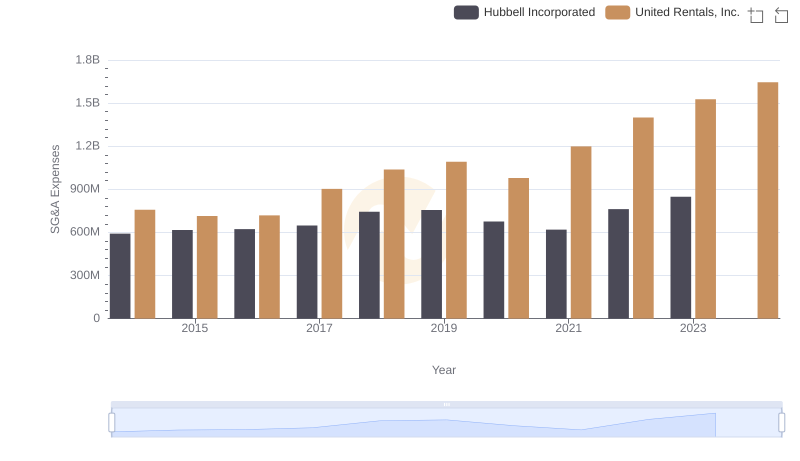
Who Optimizes SG&A Costs Better? United Rentals, Inc. or Hubbell Incorporated
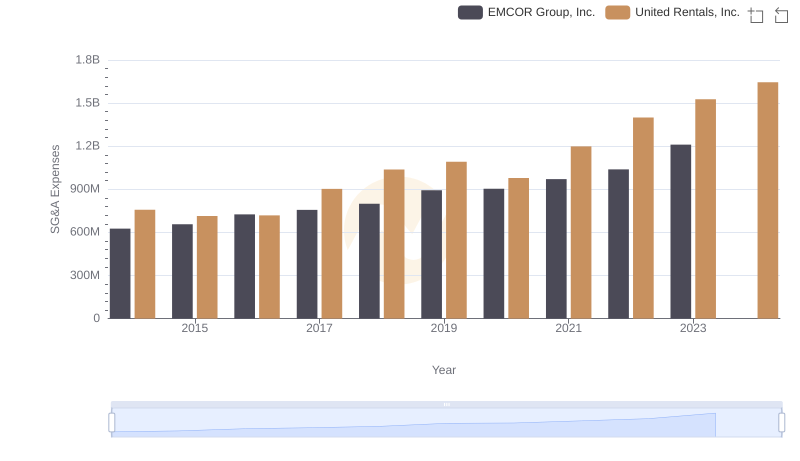
SG&A Efficiency Analysis: Comparing United Rentals, Inc. and EMCOR Group, Inc.
Who Optimizes SG&A Costs Better? United Rentals, Inc. or Builders FirstSource, Inc.
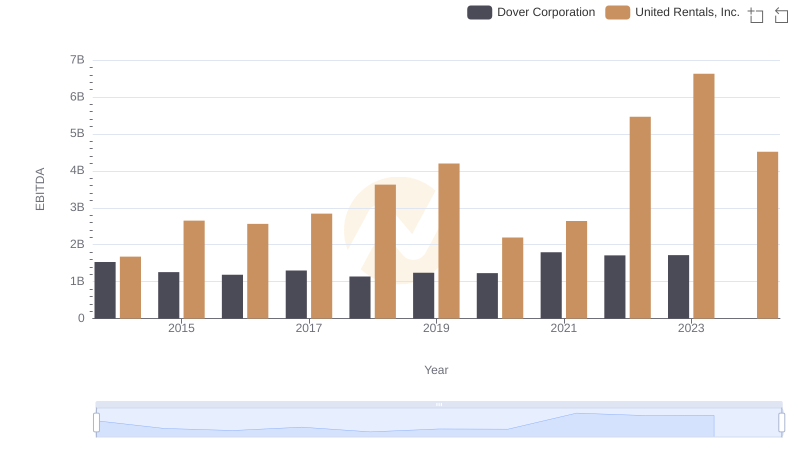
Comparative EBITDA Analysis: United Rentals, Inc. vs Dover Corporation
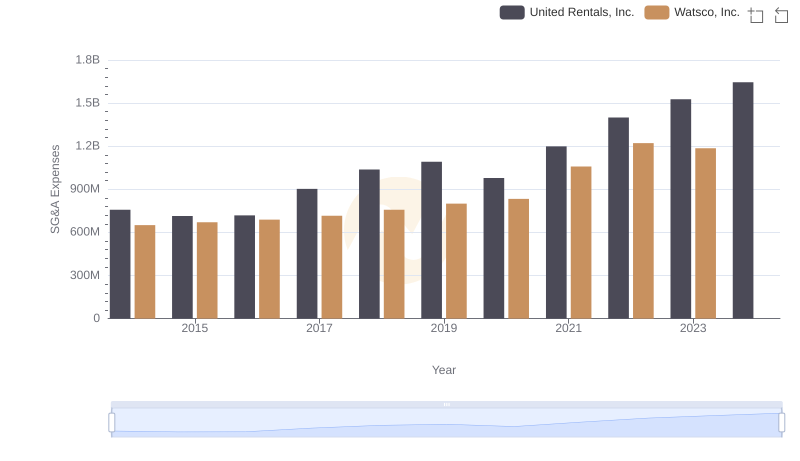
Cost Management Insights: SG&A Expenses for United Rentals, Inc. and Watsco, Inc.