| __timestamp | Cintas Corporation | Trane Technologies plc |
|---|---|---|
| Wednesday, January 1, 2014 | 2637426000 | 8982800000 |
| Thursday, January 1, 2015 | 2555549000 | 9301600000 |
| Friday, January 1, 2016 | 2775588000 | 9329300000 |
| Sunday, January 1, 2017 | 2943086000 | 9811600000 |
| Monday, January 1, 2018 | 3568109000 | 10847600000 |
| Tuesday, January 1, 2019 | 3763715000 | 11451500000 |
| Wednesday, January 1, 2020 | 3851372000 | 8651300000 |
| Friday, January 1, 2021 | 3801689000 | 9666800000 |
| Saturday, January 1, 2022 | 4222213000 | 11026900000 |
| Sunday, January 1, 2023 | 4642401000 | 11820400000 |
| Monday, January 1, 2024 | 4910199000 | 12757700000 |
Cracking the code
In the competitive landscape of industrial and service sectors, cost efficiency is a critical metric. Trane Technologies plc and Cintas Corporation, two industry giants, have shown distinct trends in their cost of revenue from 2014 to 2023. Trane Technologies consistently maintained a higher cost of revenue, peaking at approximately $11.8 billion in 2023, reflecting its expansive operations. In contrast, Cintas Corporation's cost of revenue grew steadily, reaching around $4.9 billion in 2023, marking a 90% increase from 2014. This growth highlights Cintas's strategic expansion and operational scaling. Notably, 2020 saw a dip for Trane, likely due to global disruptions, while Cintas continued its upward trajectory. The data for 2024 is incomplete, suggesting ongoing developments. This analysis underscores the importance of cost management in sustaining competitive advantage and profitability in dynamic markets.
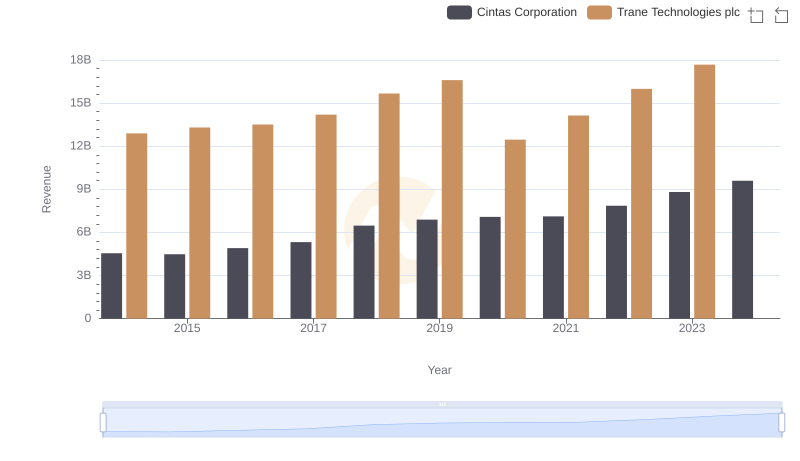
Trane Technologies plc vs Cintas Corporation: Annual Revenue Growth Compared
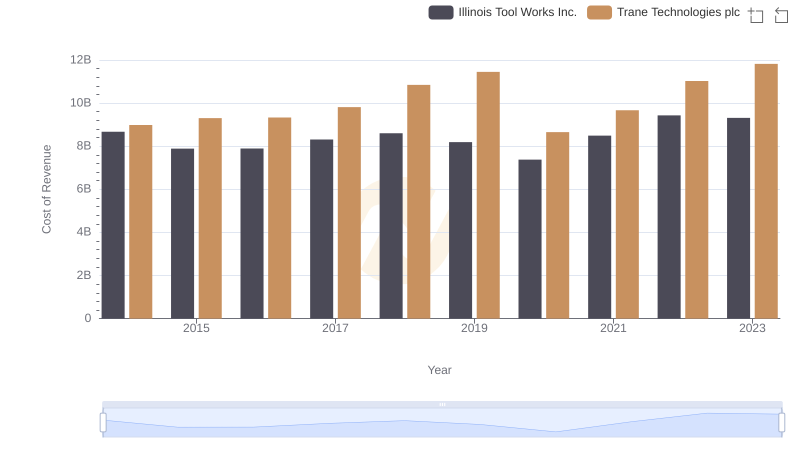
Trane Technologies plc vs Illinois Tool Works Inc.: Efficiency in Cost of Revenue Explored
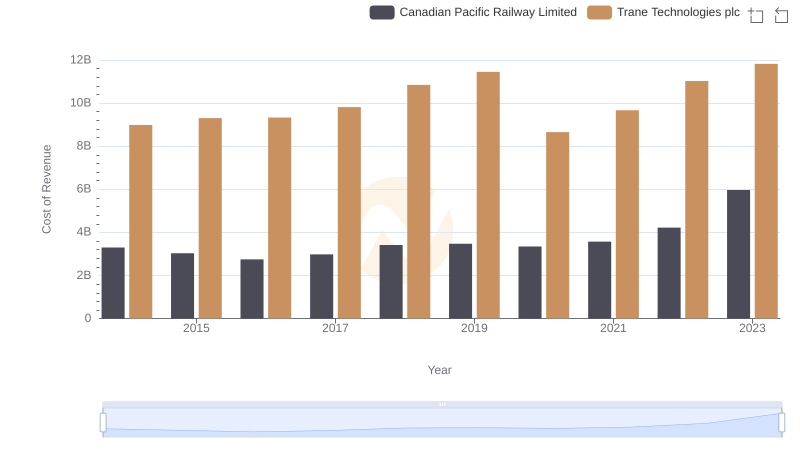
Trane Technologies plc vs Canadian Pacific Railway Limited: Efficiency in Cost of Revenue Explored
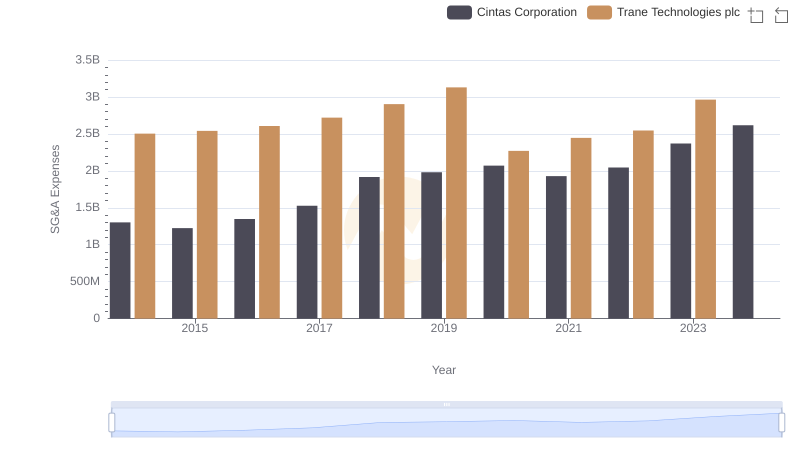
Trane Technologies plc vs Cintas Corporation: SG&A Expense Trends
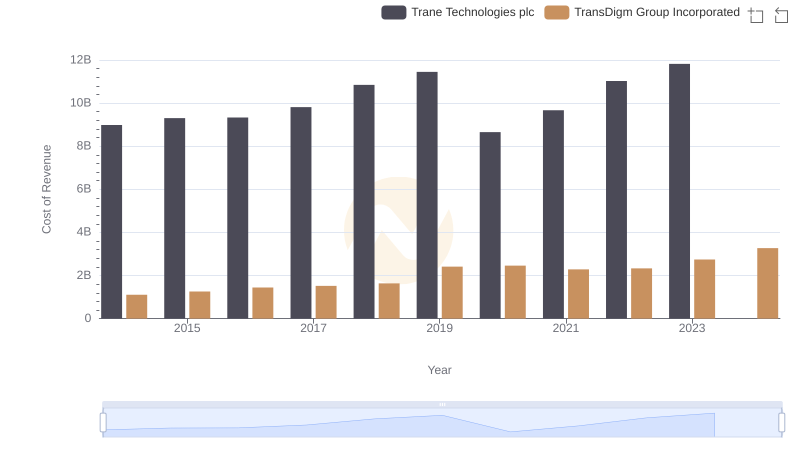
Comparing Cost of Revenue Efficiency: Trane Technologies plc vs TransDigm Group Incorporated
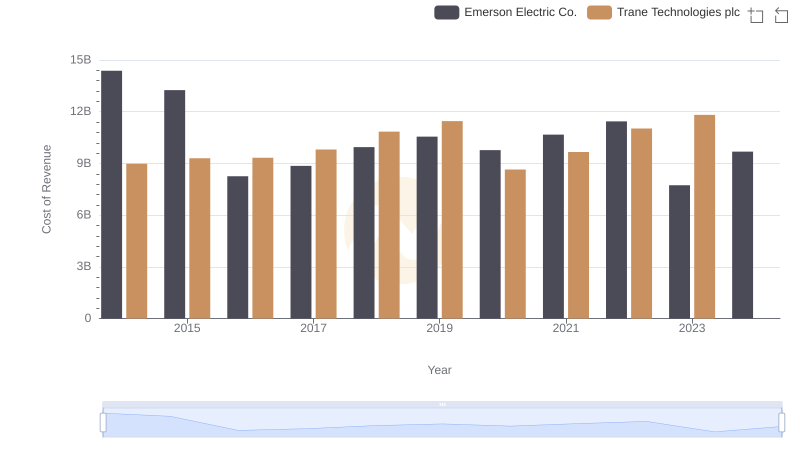
Cost of Revenue Comparison: Trane Technologies plc vs Emerson Electric Co.
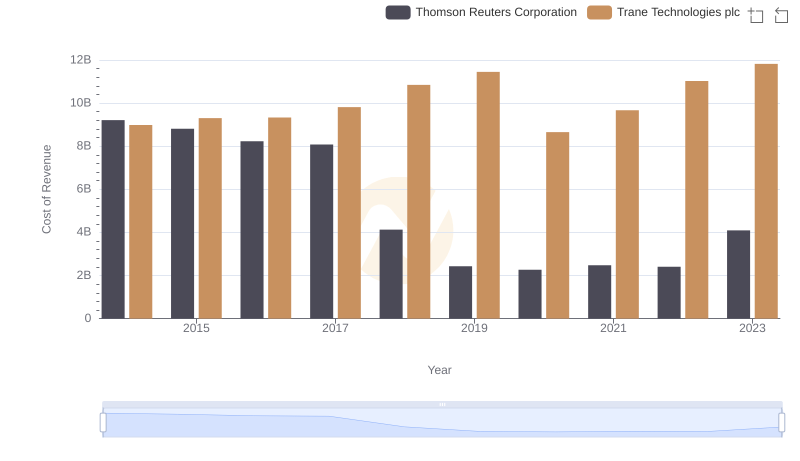
Cost of Revenue Comparison: Trane Technologies plc vs Thomson Reuters Corporation
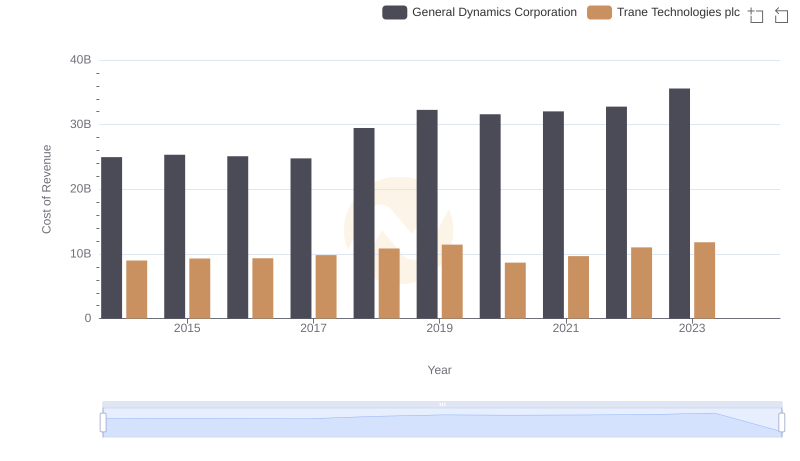
Cost of Revenue Trends: Trane Technologies plc vs General Dynamics Corporation
Cost of Revenue Trends: Trane Technologies plc vs FedEx Corporation
Professional EBITDA Benchmarking: Trane Technologies plc vs Cintas Corporation