| __timestamp | Cintas Corporation | Trane Technologies plc |
|---|---|---|
| Wednesday, January 1, 2014 | 4551812000 | 12891400000 |
| Thursday, January 1, 2015 | 4476886000 | 13300700000 |
| Friday, January 1, 2016 | 4905458000 | 13508900000 |
| Sunday, January 1, 2017 | 5323381000 | 14197600000 |
| Monday, January 1, 2018 | 6476632000 | 15668200000 |
| Tuesday, January 1, 2019 | 6892303000 | 16598900000 |
| Wednesday, January 1, 2020 | 7085120000 | 12454700000 |
| Friday, January 1, 2021 | 7116340000 | 14136400000 |
| Saturday, January 1, 2022 | 7854459000 | 15991700000 |
| Sunday, January 1, 2023 | 8815769000 | 17677600000 |
| Monday, January 1, 2024 | 9596615000 | 19838200000 |
In pursuit of knowledge
In the ever-evolving landscape of industrial and service sectors, Trane Technologies plc and Cintas Corporation stand as titans. Over the past decade, these companies have showcased remarkable revenue trajectories, reflecting their strategic prowess and market adaptability.
From 2014 to 2023, Cintas Corporation has seen its revenue grow by approximately 110%, starting from $4.6 billion to nearly $9.6 billion. This consistent upward trend highlights Cintas's robust business model and its ability to capture market share.
Conversely, Trane Technologies, a leader in climate innovation, experienced a 37% increase in revenue from 2014 to 2023, peaking at $17.7 billion in 2023. However, data for 2024 remains elusive, leaving room for speculation on future performance.
Both companies exemplify resilience and growth, yet their paths diverge, offering intriguing insights into their respective industries.
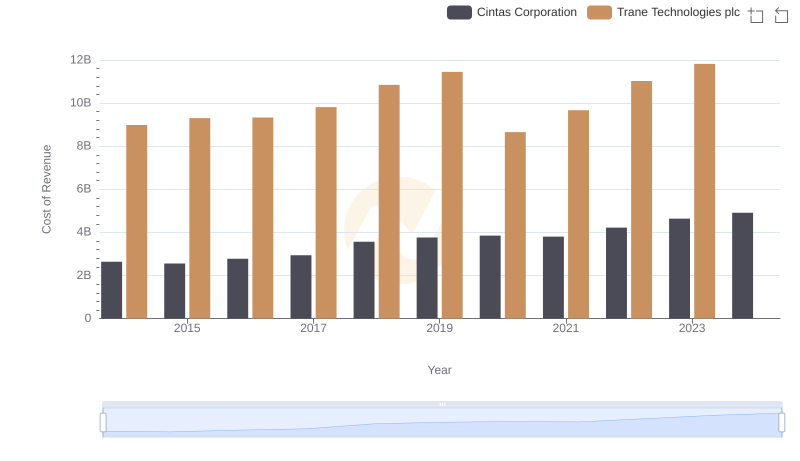
Trane Technologies plc vs Cintas Corporation: Efficiency in Cost of Revenue Explored
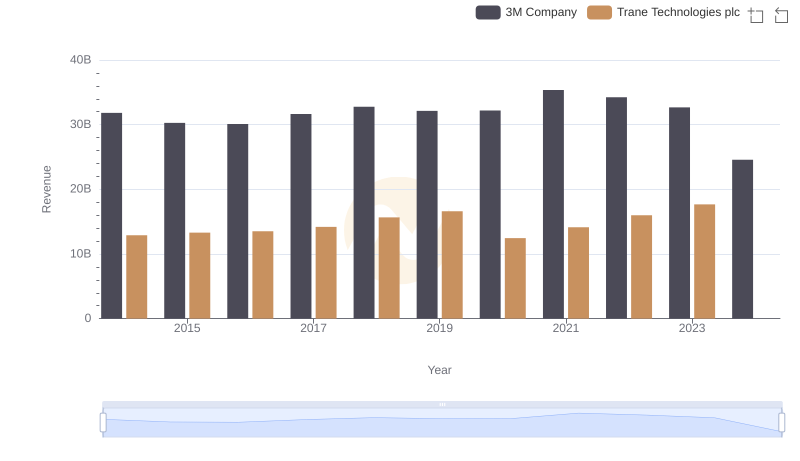
Annual Revenue Comparison: Trane Technologies plc vs 3M Company
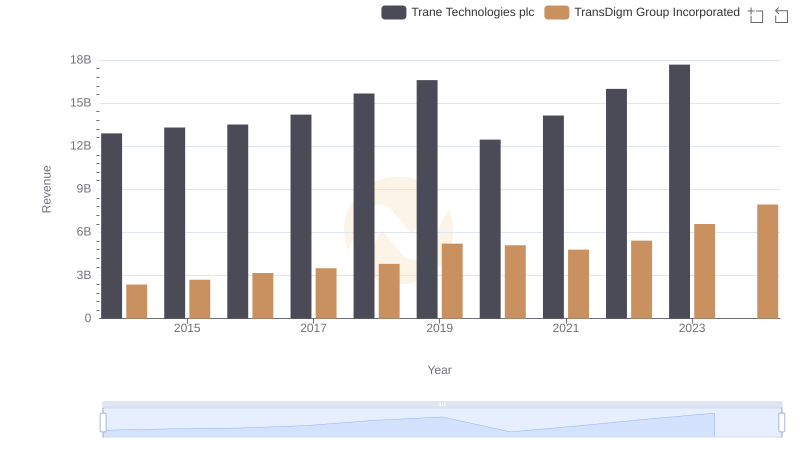
Trane Technologies plc vs TransDigm Group Incorporated: Annual Revenue Growth Compared
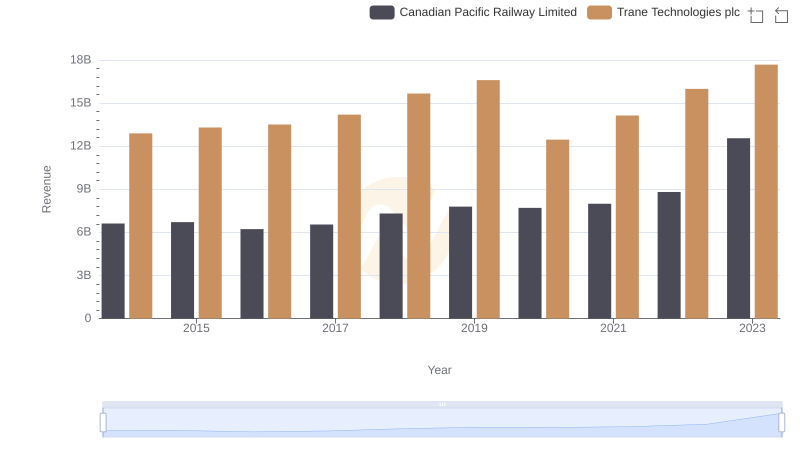
Revenue Showdown: Trane Technologies plc vs Canadian Pacific Railway Limited
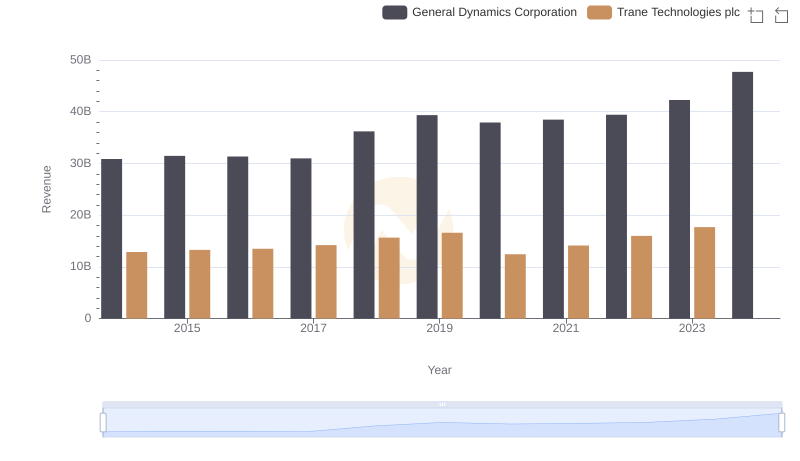
Trane Technologies plc vs General Dynamics Corporation: Annual Revenue Growth Compared
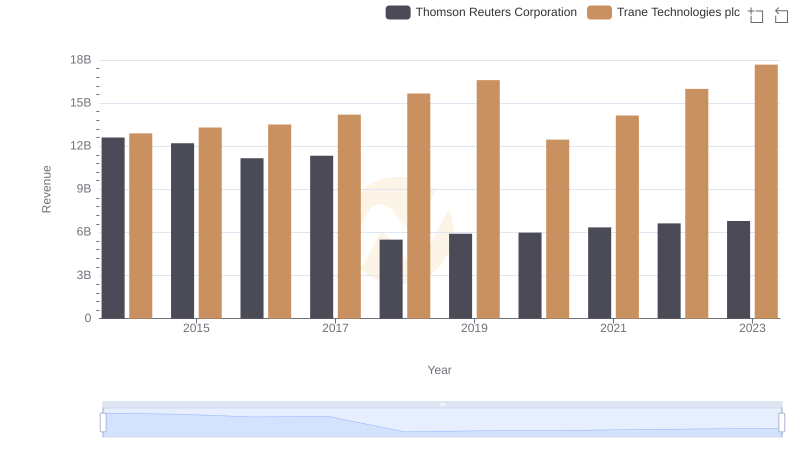
Annual Revenue Comparison: Trane Technologies plc vs Thomson Reuters Corporation
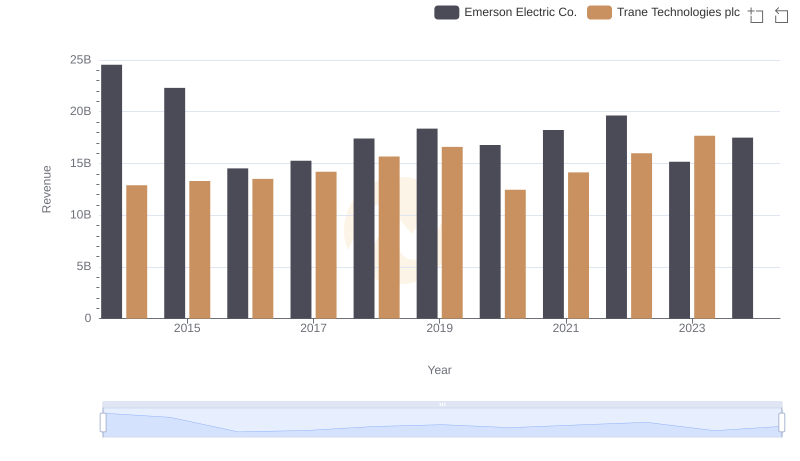
Revenue Insights: Trane Technologies plc and Emerson Electric Co. Performance Compared
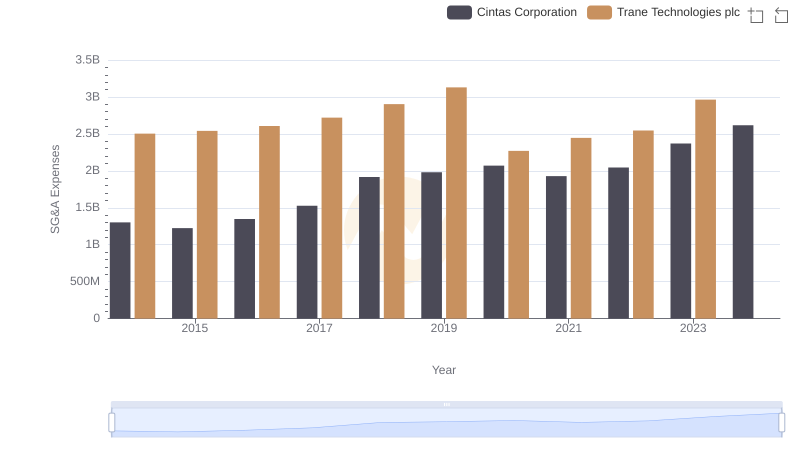
Trane Technologies plc vs Cintas Corporation: SG&A Expense Trends
Professional EBITDA Benchmarking: Trane Technologies plc vs Cintas Corporation