| __timestamp | Cintas Corporation | Trane Technologies plc |
|---|---|---|
| Wednesday, January 1, 2014 | 1302752000 | 2503900000 |
| Thursday, January 1, 2015 | 1224930000 | 2541100000 |
| Friday, January 1, 2016 | 1348122000 | 2606500000 |
| Sunday, January 1, 2017 | 1527380000 | 2720700000 |
| Monday, January 1, 2018 | 1916792000 | 2903200000 |
| Tuesday, January 1, 2019 | 1980644000 | 3129800000 |
| Wednesday, January 1, 2020 | 2071052000 | 2270600000 |
| Friday, January 1, 2021 | 1929159000 | 2446300000 |
| Saturday, January 1, 2022 | 2044876000 | 2545900000 |
| Sunday, January 1, 2023 | 2370704000 | 2963200000 |
| Monday, January 1, 2024 | 2617783000 | 3580400000 |
Data in motion
In the ever-evolving landscape of corporate finance, understanding the trends in Selling, General, and Administrative (SG&A) expenses is crucial for investors and analysts alike. This analysis delves into the SG&A expense patterns of two industry giants: Trane Technologies plc and Cintas Corporation, from 2014 to 2023.
Over the past decade, Trane Technologies has consistently maintained higher SG&A expenses compared to Cintas, peaking in 2019 with a 25% increase from 2014. However, 2020 marked a significant dip for Trane, with expenses dropping by 27% from the previous year, reflecting potential strategic shifts or market conditions. In contrast, Cintas demonstrated a steady upward trajectory, culminating in a 100% increase by 2024.
While 2024 data for Trane is unavailable, the trend suggests a potential rebound. Investors should watch for future reports to gauge ongoing strategies.
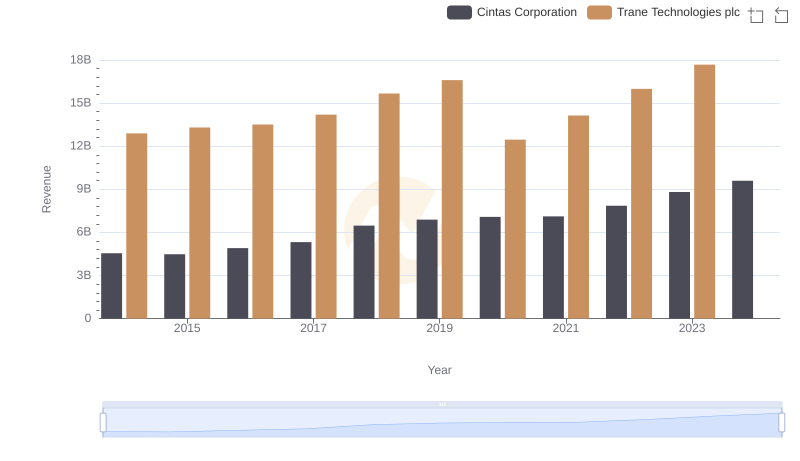
Trane Technologies plc vs Cintas Corporation: Annual Revenue Growth Compared
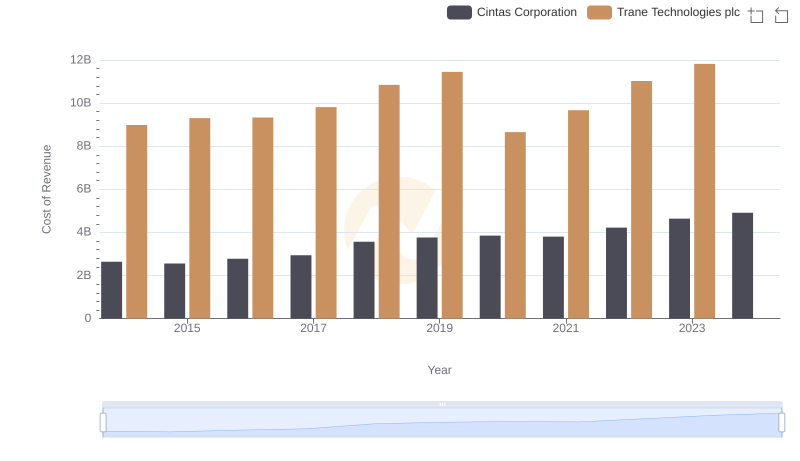
Trane Technologies plc vs Cintas Corporation: Efficiency in Cost of Revenue Explored
Professional EBITDA Benchmarking: Trane Technologies plc vs Cintas Corporation
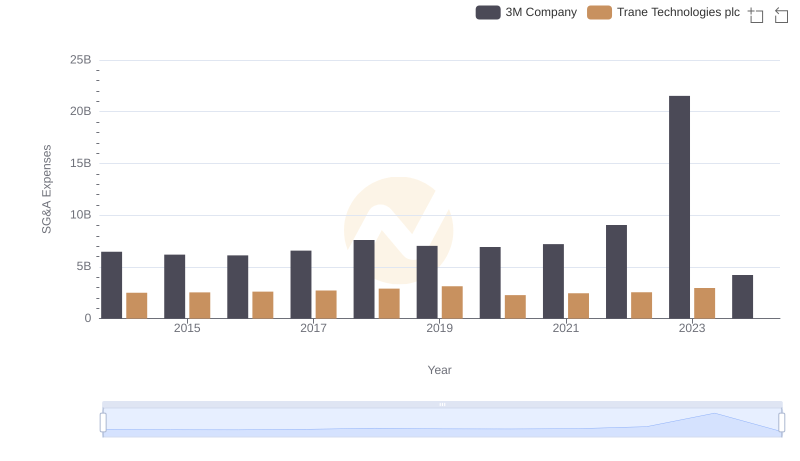
Breaking Down SG&A Expenses: Trane Technologies plc vs 3M Company
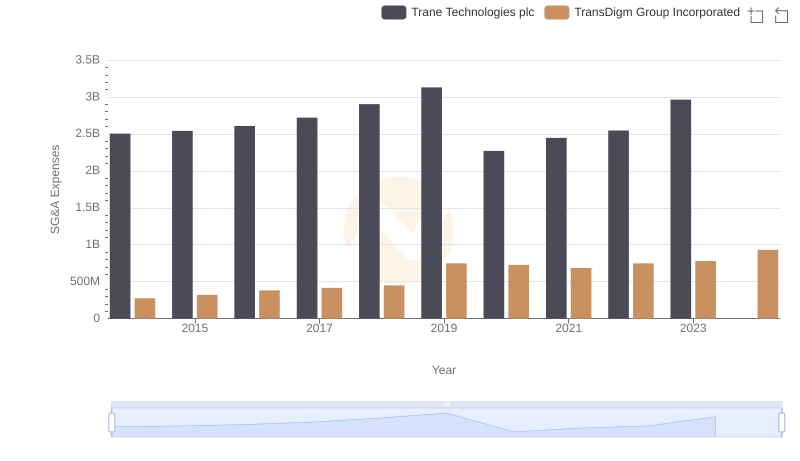
Trane Technologies plc and TransDigm Group Incorporated: SG&A Spending Patterns Compared
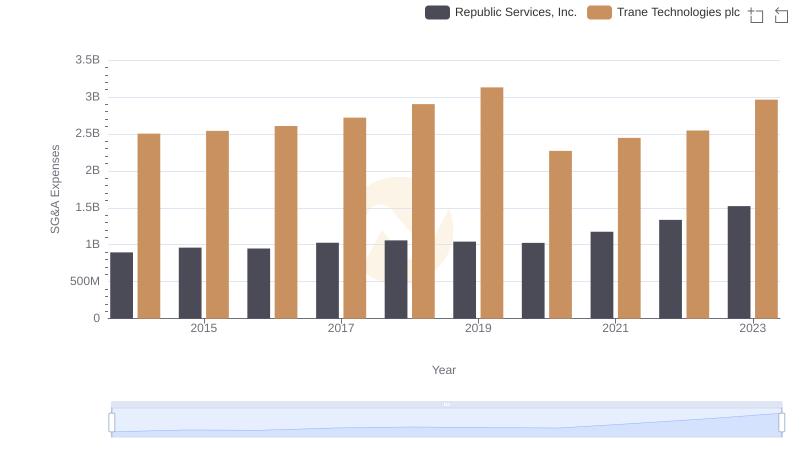
Cost Management Insights: SG&A Expenses for Trane Technologies plc and Republic Services, Inc.
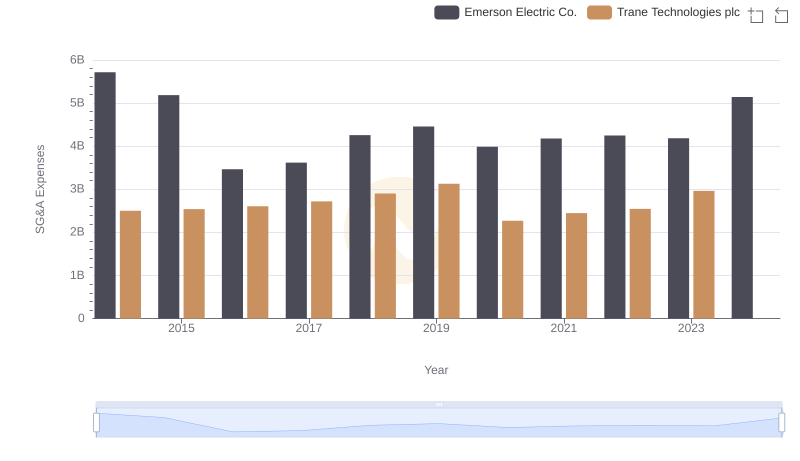
Operational Costs Compared: SG&A Analysis of Trane Technologies plc and Emerson Electric Co.
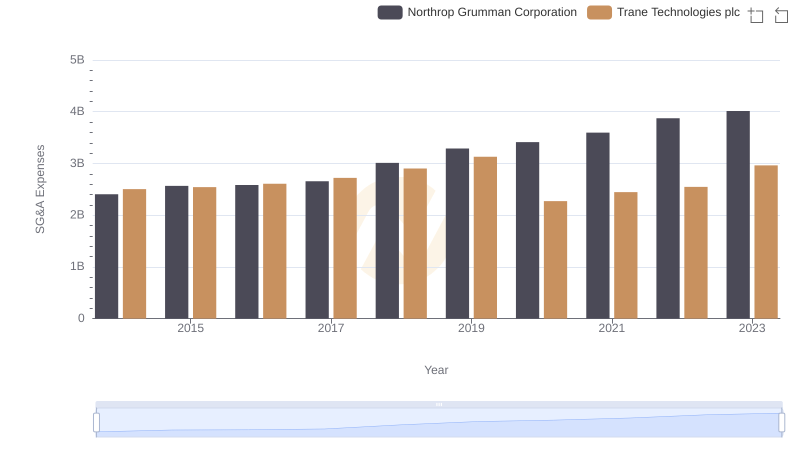
Trane Technologies plc vs Northrop Grumman Corporation: SG&A Expense Trends