| __timestamp | Cintas Corporation | Trane Technologies plc |
|---|---|---|
| Wednesday, January 1, 2014 | 793811000 | 1757000000 |
| Thursday, January 1, 2015 | 877761000 | 1835000000 |
| Friday, January 1, 2016 | 933728000 | 2311000000 |
| Sunday, January 1, 2017 | 968293000 | 1982500000 |
| Monday, January 1, 2018 | 1227852000 | 2242400000 |
| Tuesday, January 1, 2019 | 1564228000 | 1931200000 |
| Wednesday, January 1, 2020 | 1542737000 | 1831900000 |
| Friday, January 1, 2021 | 1773591000 | 2319200000 |
| Saturday, January 1, 2022 | 1990046000 | 2715500000 |
| Sunday, January 1, 2023 | 2221676000 | 3149900000 |
| Monday, January 1, 2024 | 2523857000 | 3859600000 |
Infusing magic into the data realm
In the competitive landscape of industrial and service sectors, Trane Technologies plc and Cintas Corporation have emerged as significant players. Over the past decade, from 2014 to 2023, these companies have demonstrated robust growth in their EBITDA, a key indicator of financial health and operational efficiency.
Trane Technologies has shown a remarkable 79% increase in EBITDA, peaking at approximately $3.15 billion in 2023. Meanwhile, Cintas Corporation has not lagged far behind, with a 217% growth, reaching around $2.22 billion in the same year. This growth trajectory highlights the resilience and strategic prowess of both companies in navigating market challenges.
However, the data for 2024 is incomplete, with Trane Technologies' figures yet to be reported. This gap presents an opportunity for investors and analysts to speculate on future performance and market dynamics.
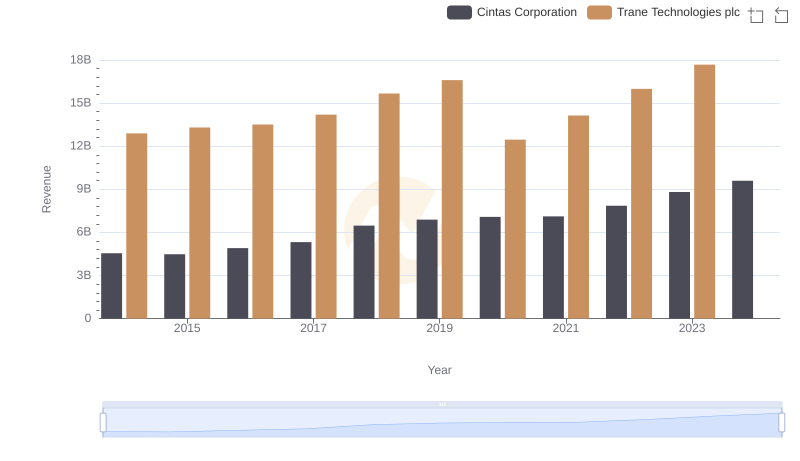
Trane Technologies plc vs Cintas Corporation: Annual Revenue Growth Compared
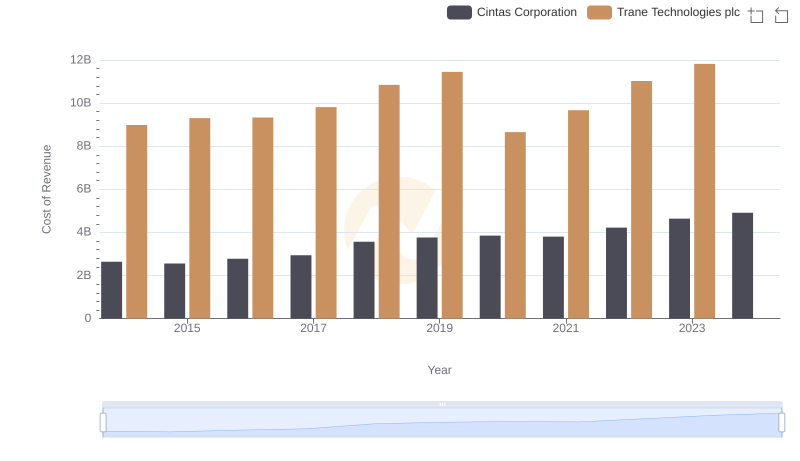
Trane Technologies plc vs Cintas Corporation: Efficiency in Cost of Revenue Explored
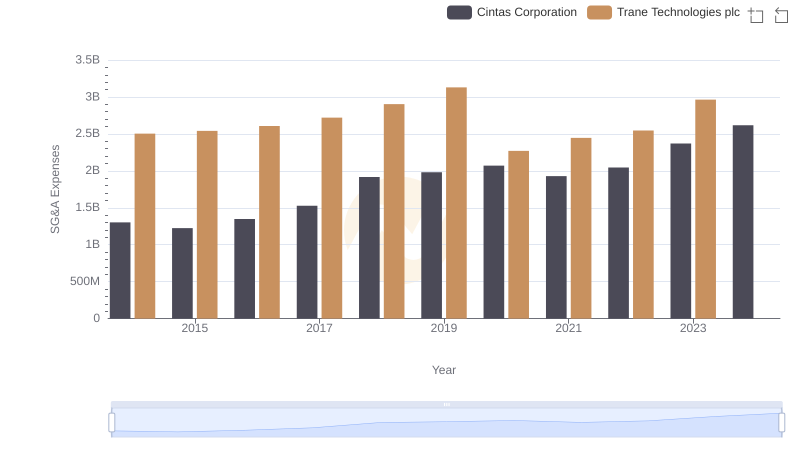
Trane Technologies plc vs Cintas Corporation: SG&A Expense Trends
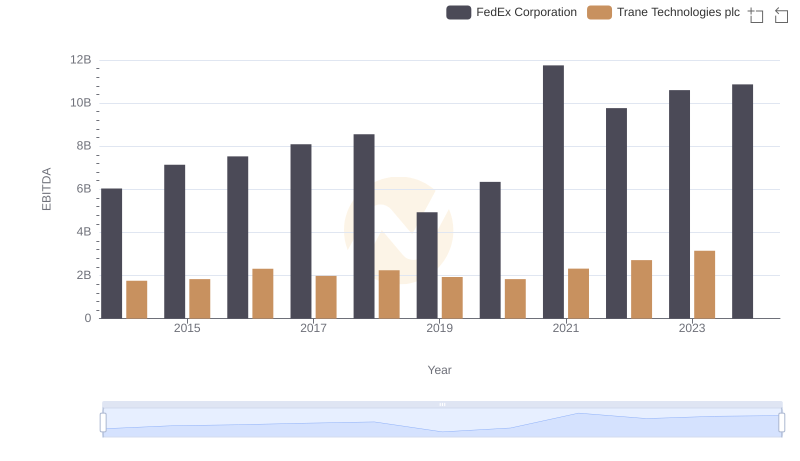
EBITDA Performance Review: Trane Technologies plc vs FedEx Corporation
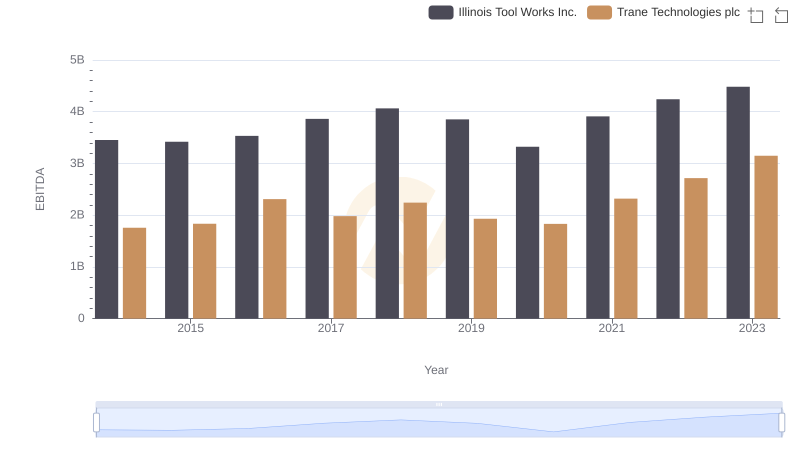
EBITDA Performance Review: Trane Technologies plc vs Illinois Tool Works Inc.
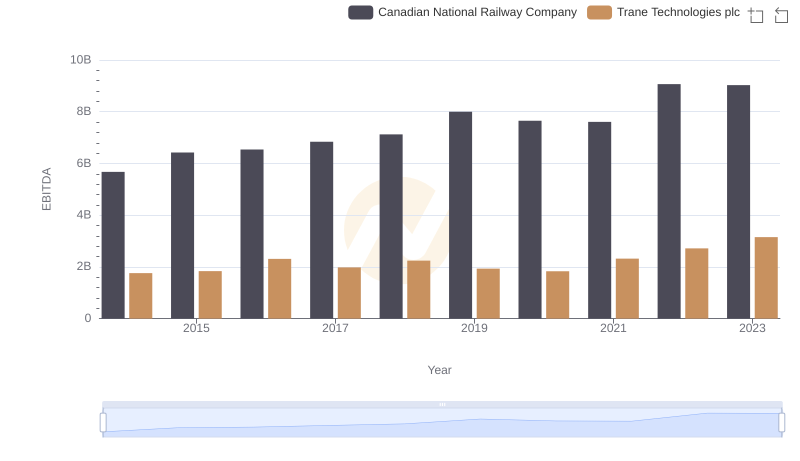
A Professional Review of EBITDA: Trane Technologies plc Compared to Canadian National Railway Company
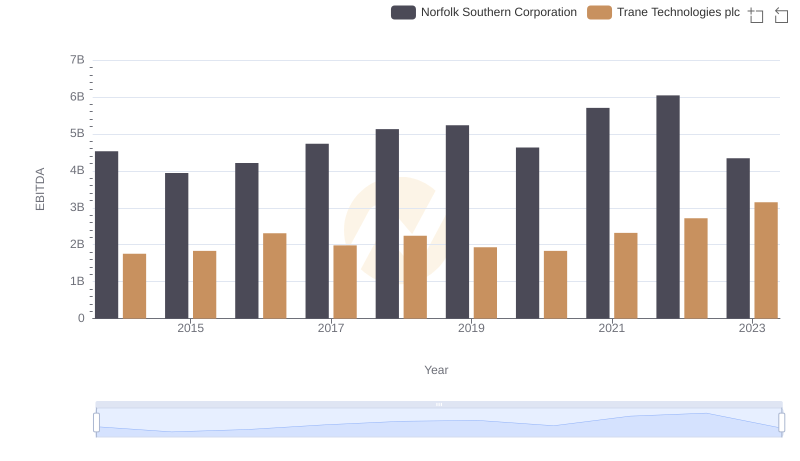
EBITDA Analysis: Evaluating Trane Technologies plc Against Norfolk Southern Corporation
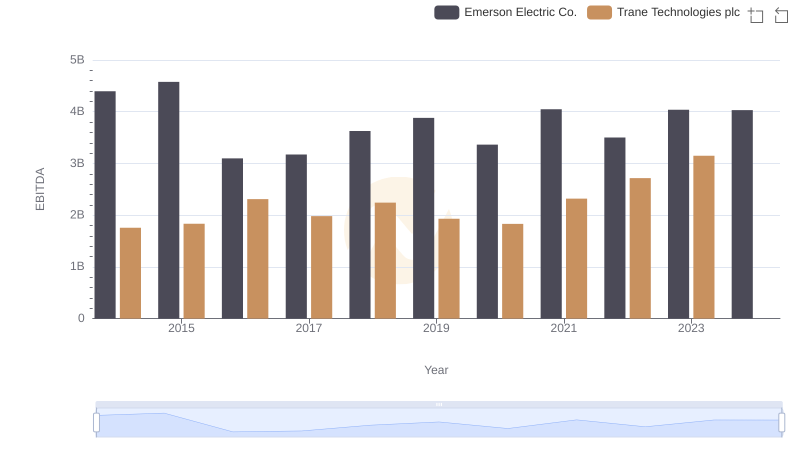
Comparative EBITDA Analysis: Trane Technologies plc vs Emerson Electric Co.
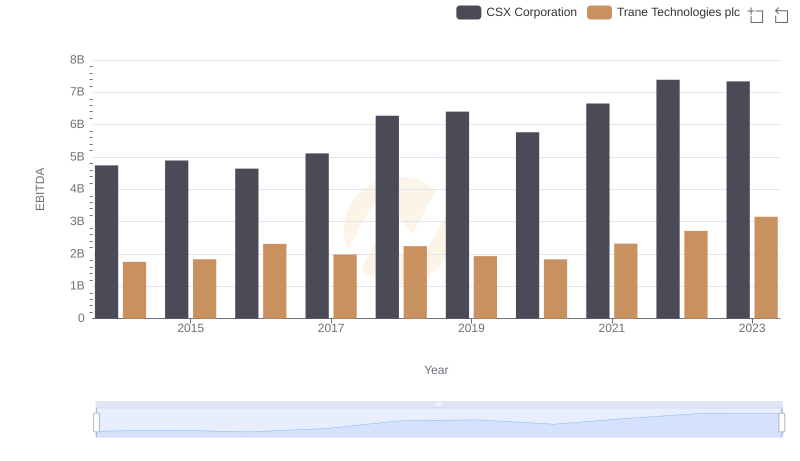
EBITDA Performance Review: Trane Technologies plc vs CSX Corporation