| __timestamp | AerCap Holdings N.V. | Waste Management, Inc. |
|---|---|---|
| Wednesday, January 1, 2014 | 299900000 | 1481000000 |
| Thursday, January 1, 2015 | 381308000 | 1343000000 |
| Friday, January 1, 2016 | 351012000 | 1410000000 |
| Sunday, January 1, 2017 | 348291000 | 1468000000 |
| Monday, January 1, 2018 | 305226000 | 1453000000 |
| Tuesday, January 1, 2019 | 267458000 | 1631000000 |
| Wednesday, January 1, 2020 | 242161000 | 1728000000 |
| Friday, January 1, 2021 | 317888000 | 1864000000 |
| Saturday, January 1, 2022 | 399530000 | 1938000000 |
| Sunday, January 1, 2023 | 464128000 | 1926000000 |
| Monday, January 1, 2024 | 2264000000 |
Infusing magic into the data realm
In the world of corporate finance, Selling, General, and Administrative (SG&A) expenses are a critical measure of operational efficiency. This analysis compares the SG&A efficiency of Waste Management, Inc. and AerCap Holdings N.V. over a decade, from 2014 to 2023.
Waste Management, Inc. consistently demonstrated robust SG&A management, with expenses peaking at approximately $1.93 billion in 2022. This represents a steady increase of about 30% from 2014, reflecting strategic investments in operational efficiency.
AerCap Holdings N.V., on the other hand, showed a more volatile SG&A trend. Starting at around $300 million in 2014, their expenses surged by over 50% to reach nearly $464 million in 2023. This fluctuation highlights the dynamic nature of the aviation leasing industry.
Both companies illustrate distinct approaches to managing SG&A expenses, offering valuable insights into their operational strategies.
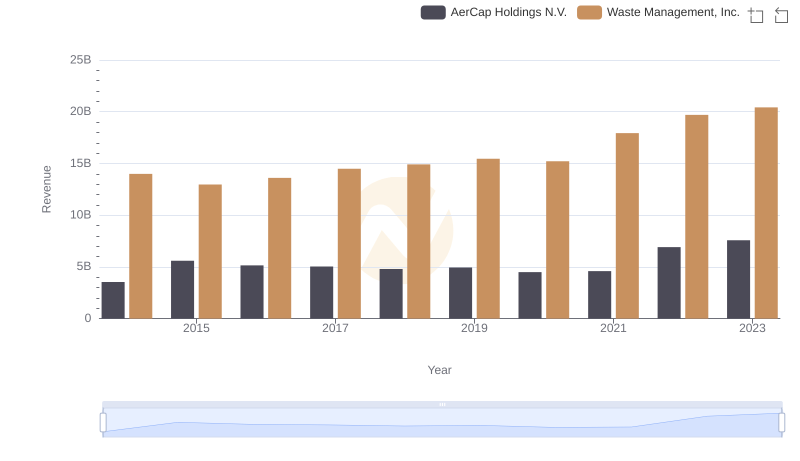
Annual Revenue Comparison: Waste Management, Inc. vs AerCap Holdings N.V.
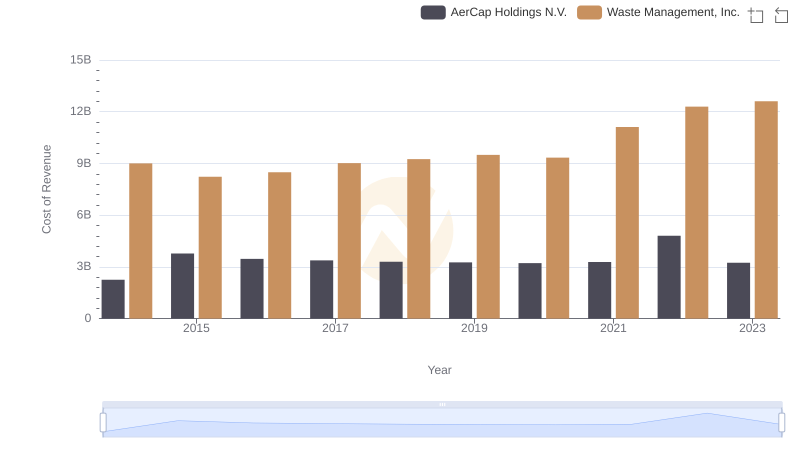
Cost of Revenue: Key Insights for Waste Management, Inc. and AerCap Holdings N.V.
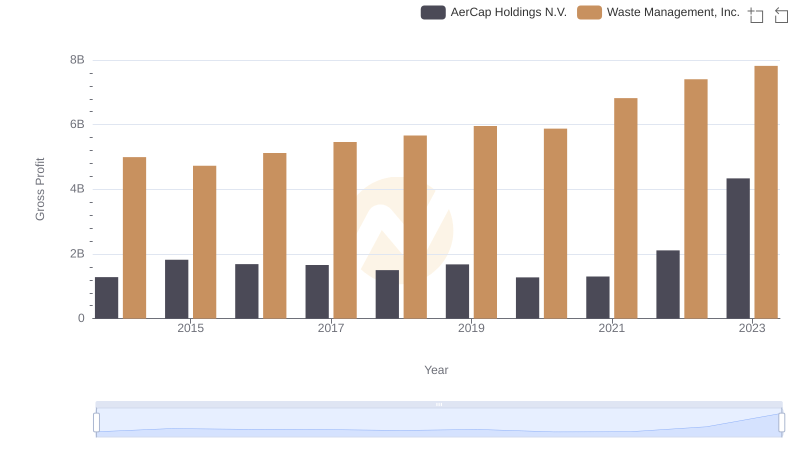
Gross Profit Analysis: Comparing Waste Management, Inc. and AerCap Holdings N.V.
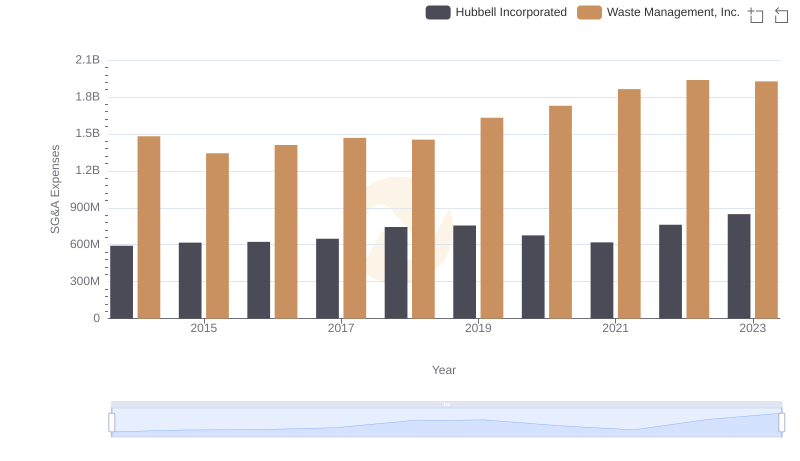
Waste Management, Inc. and Hubbell Incorporated: SG&A Spending Patterns Compared
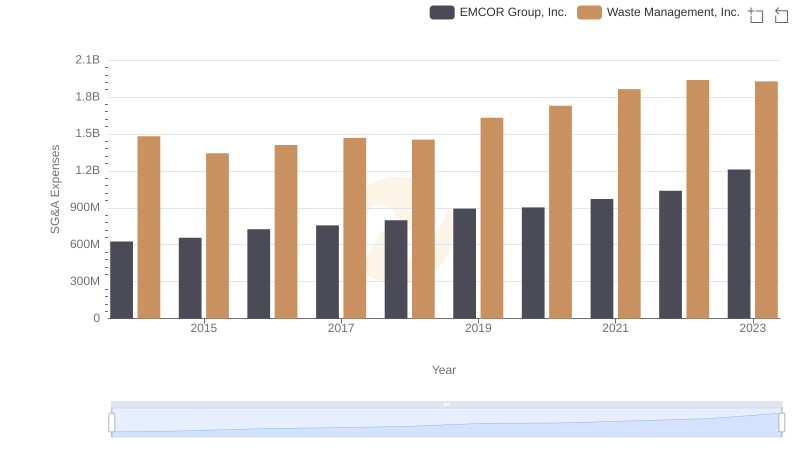
Waste Management, Inc. and EMCOR Group, Inc.: SG&A Spending Patterns Compared
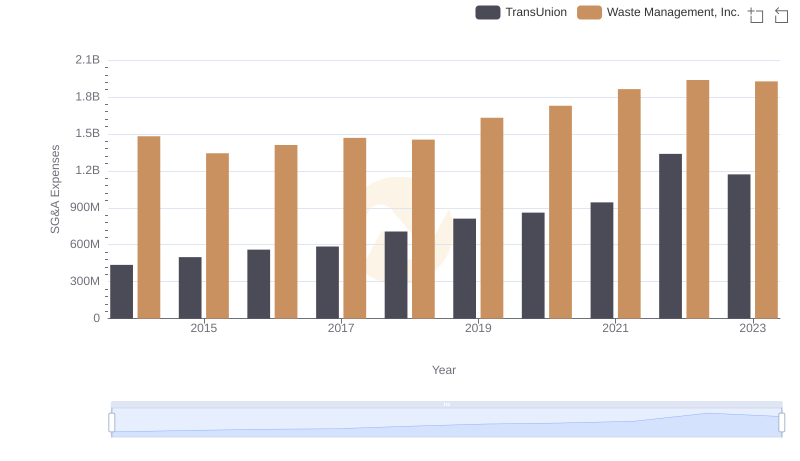
Breaking Down SG&A Expenses: Waste Management, Inc. vs TransUnion
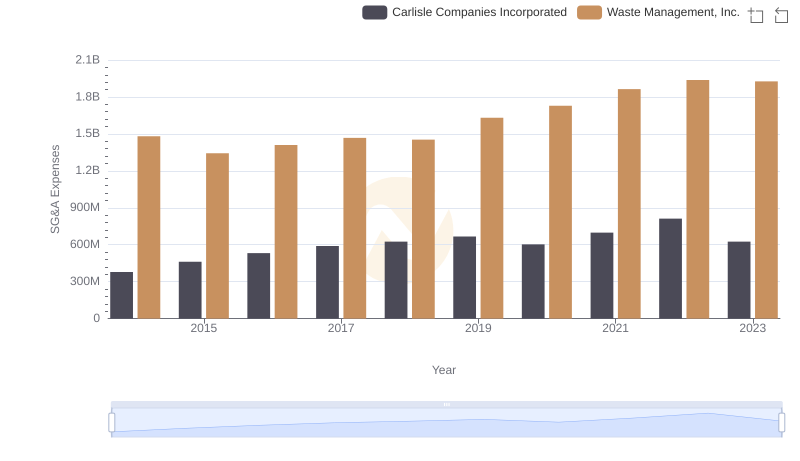
Breaking Down SG&A Expenses: Waste Management, Inc. vs Carlisle Companies Incorporated
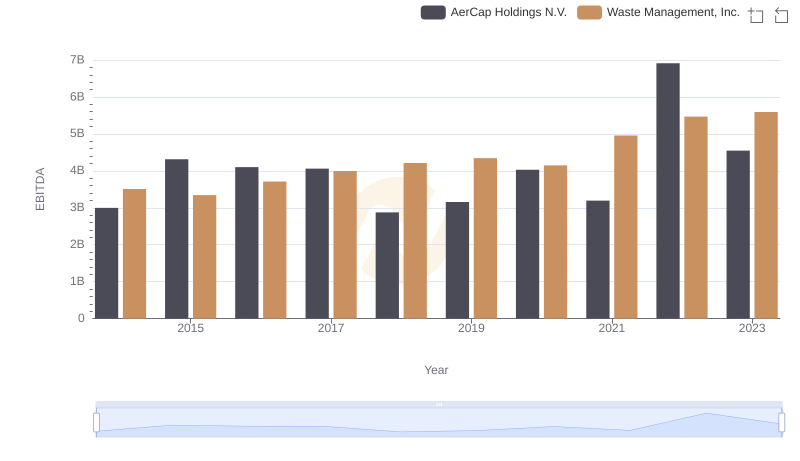
Professional EBITDA Benchmarking: Waste Management, Inc. vs AerCap Holdings N.V.
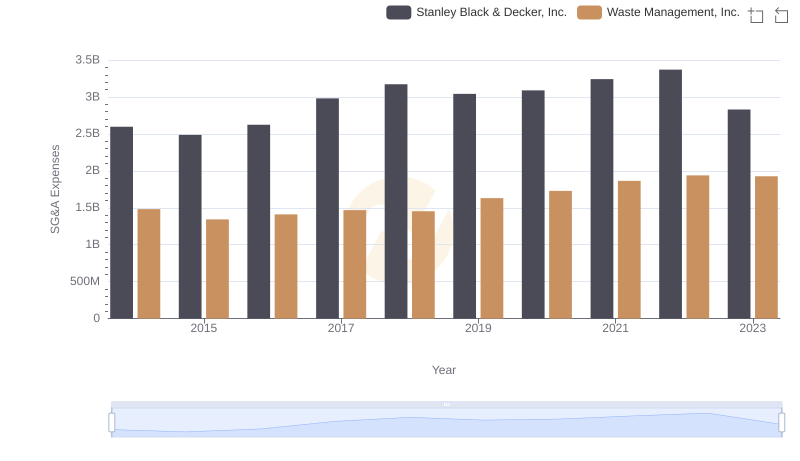
Waste Management, Inc. or Stanley Black & Decker, Inc.: Who Manages SG&A Costs Better?
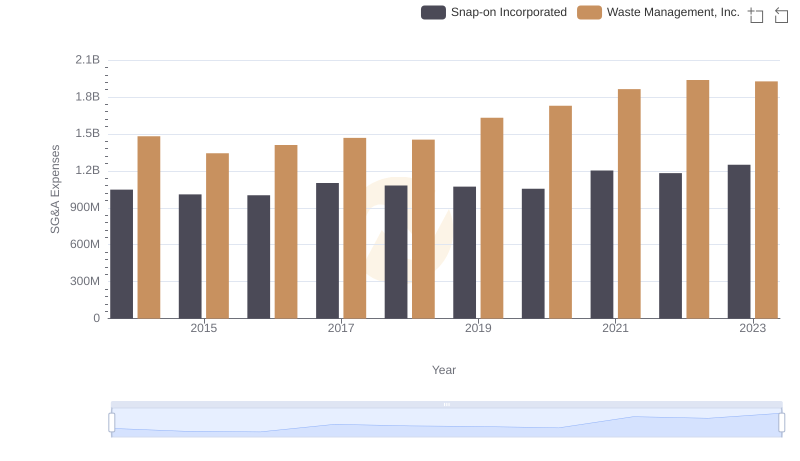
Operational Costs Compared: SG&A Analysis of Waste Management, Inc. and Snap-on Incorporated
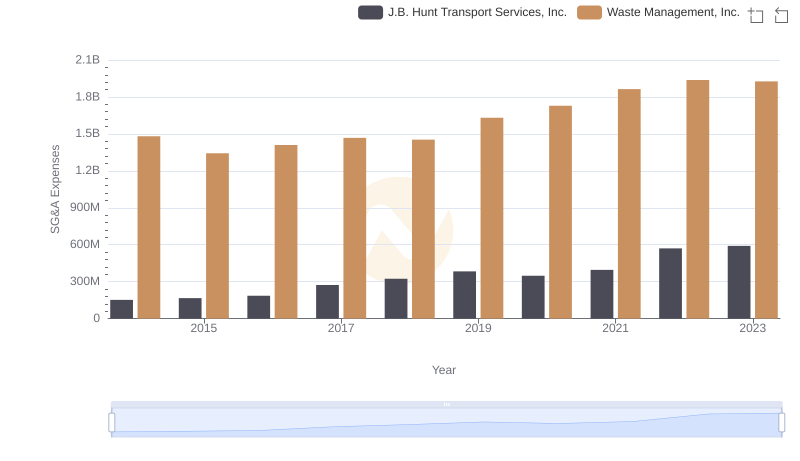
Waste Management, Inc. vs J.B. Hunt Transport Services, Inc.: SG&A Expense Trends