| __timestamp | J.B. Hunt Transport Services, Inc. | Waste Management, Inc. |
|---|---|---|
| Wednesday, January 1, 2014 | 152469000 | 1481000000 |
| Thursday, January 1, 2015 | 166799000 | 1343000000 |
| Friday, January 1, 2016 | 185436000 | 1410000000 |
| Sunday, January 1, 2017 | 273440000 | 1468000000 |
| Monday, January 1, 2018 | 323587000 | 1453000000 |
| Tuesday, January 1, 2019 | 383981000 | 1631000000 |
| Wednesday, January 1, 2020 | 348076000 | 1728000000 |
| Friday, January 1, 2021 | 395533000 | 1864000000 |
| Saturday, January 1, 2022 | 570191000 | 1938000000 |
| Sunday, January 1, 2023 | 590242000 | 1926000000 |
| Monday, January 1, 2024 | 2264000000 |
Cracking the code
In the world of logistics and waste management, two industry leaders, J.B. Hunt Transport Services, Inc. and Waste Management, Inc., have shown distinct trends in their Selling, General, and Administrative (SG&A) expenses over the past decade. From 2014 to 2023, J.B. Hunt's SG&A expenses surged by approximately 287%, reflecting its aggressive expansion and operational scaling. In contrast, Waste Management's expenses grew by a modest 30%, indicating a more stable and controlled growth strategy.
J.B. Hunt's expenses, which started at 15% of Waste Management's in 2014, have now reached 31% in 2023. This shift highlights the dynamic nature of the logistics sector compared to the relatively steady waste management industry. As these companies continue to evolve, their financial strategies will play a crucial role in shaping their future trajectories.
Explore these trends further to understand the financial strategies driving these industry titans.
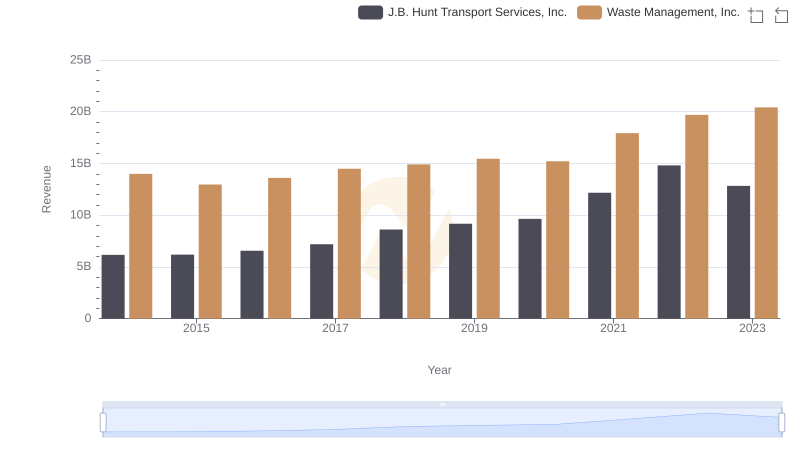
Waste Management, Inc. or J.B. Hunt Transport Services, Inc.: Who Leads in Yearly Revenue?
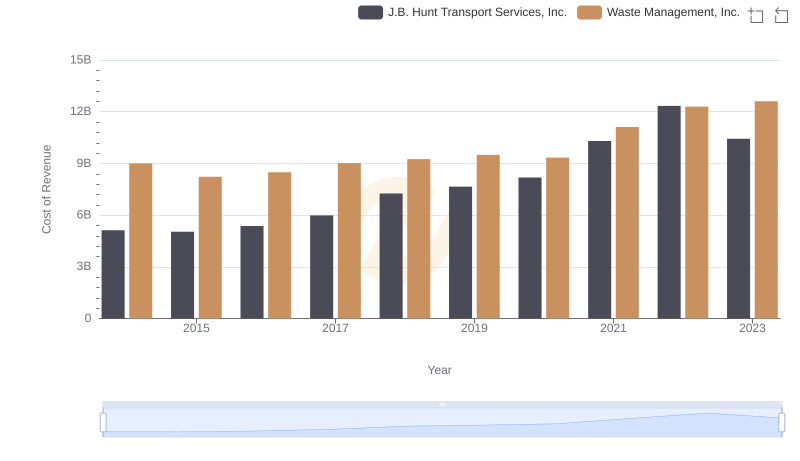
Cost of Revenue Trends: Waste Management, Inc. vs J.B. Hunt Transport Services, Inc.
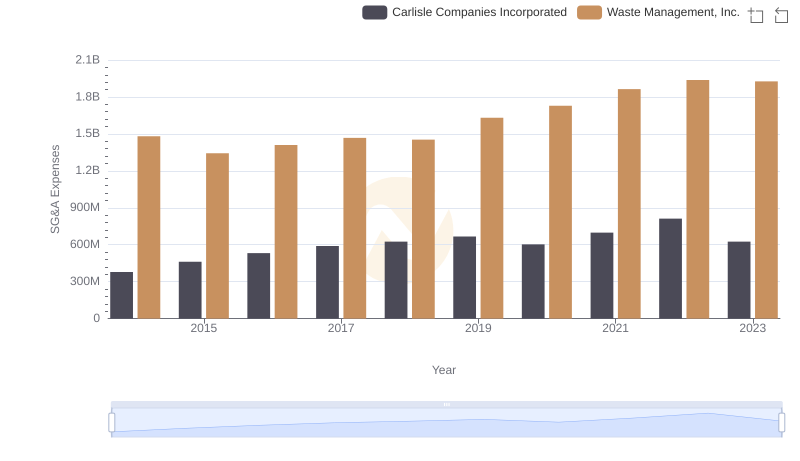
Breaking Down SG&A Expenses: Waste Management, Inc. vs Carlisle Companies Incorporated
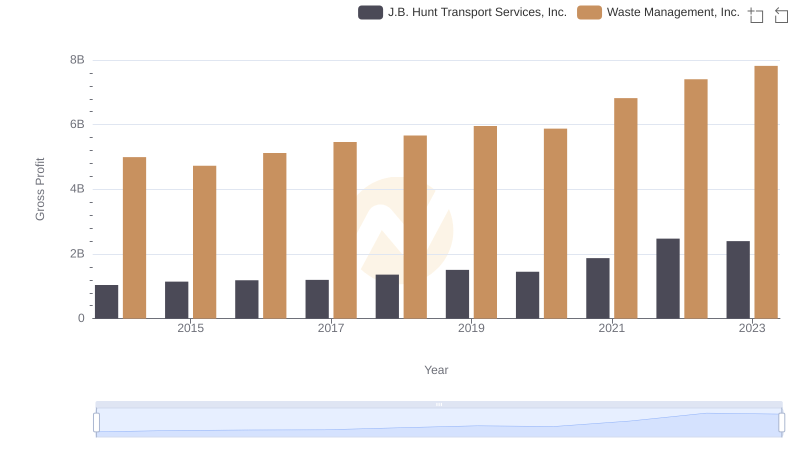
Gross Profit Analysis: Comparing Waste Management, Inc. and J.B. Hunt Transport Services, Inc.
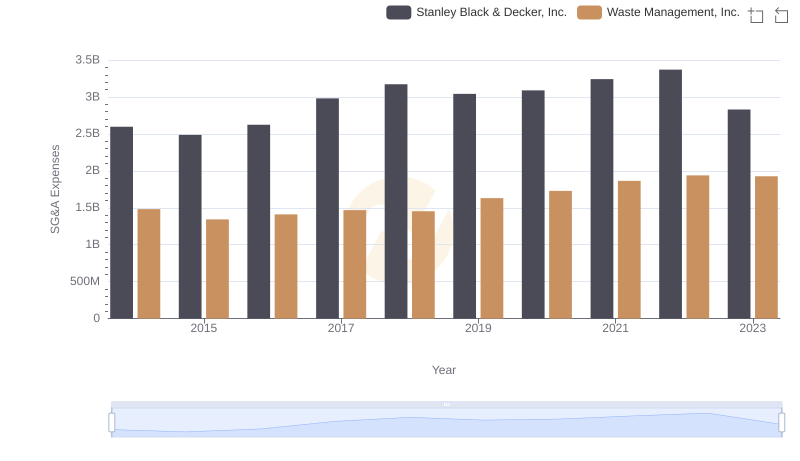
Waste Management, Inc. or Stanley Black & Decker, Inc.: Who Manages SG&A Costs Better?
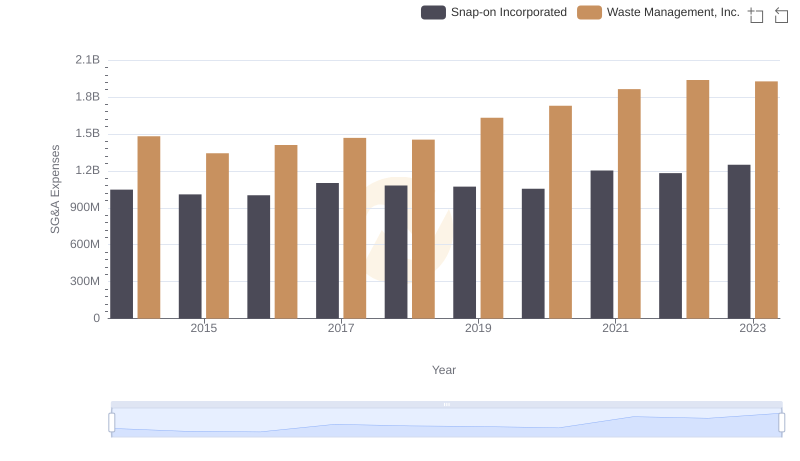
Operational Costs Compared: SG&A Analysis of Waste Management, Inc. and Snap-on Incorporated
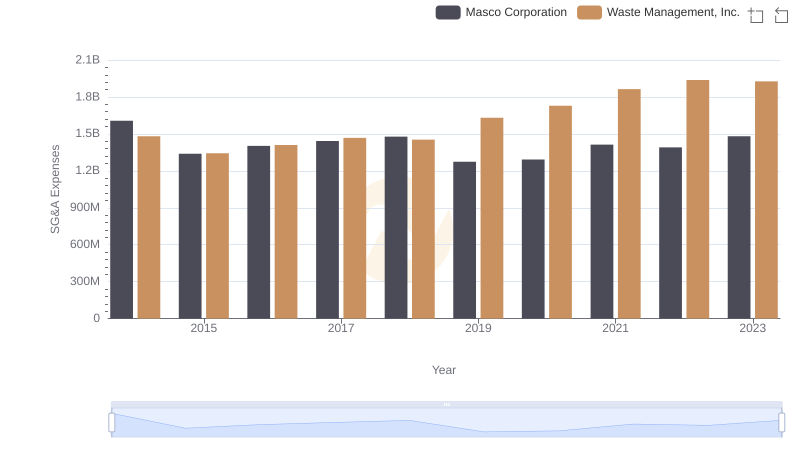
Selling, General, and Administrative Costs: Waste Management, Inc. vs Masco Corporation
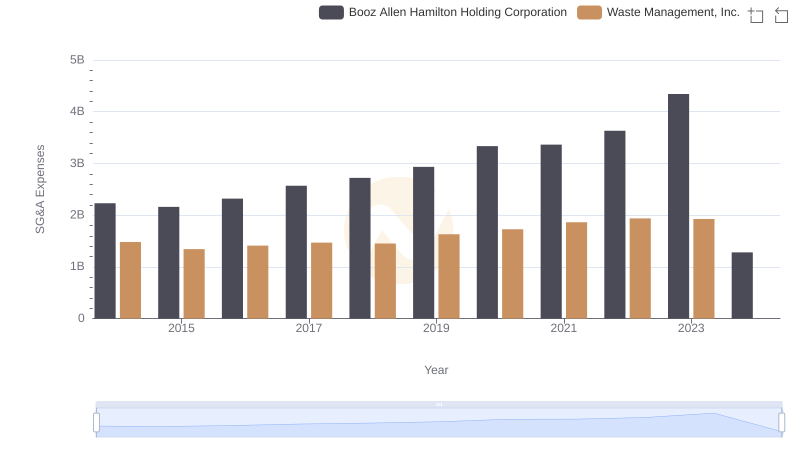
SG&A Efficiency Analysis: Comparing Waste Management, Inc. and Booz Allen Hamilton Holding Corporation
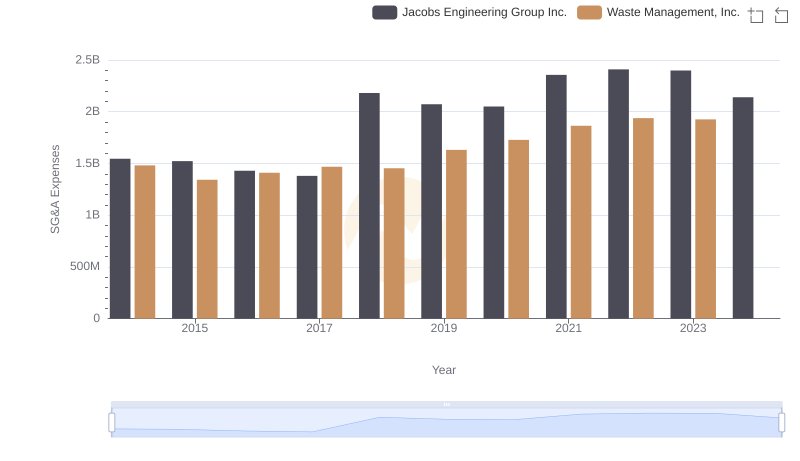
Cost Management Insights: SG&A Expenses for Waste Management, Inc. and Jacobs Engineering Group Inc.
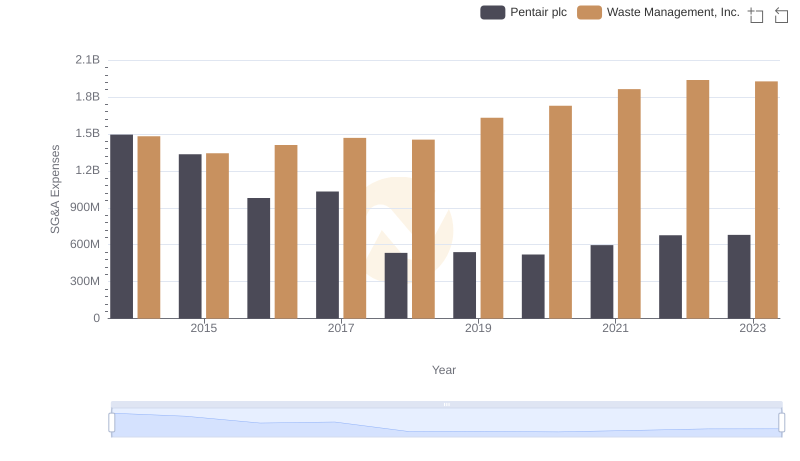
SG&A Efficiency Analysis: Comparing Waste Management, Inc. and Pentair plc
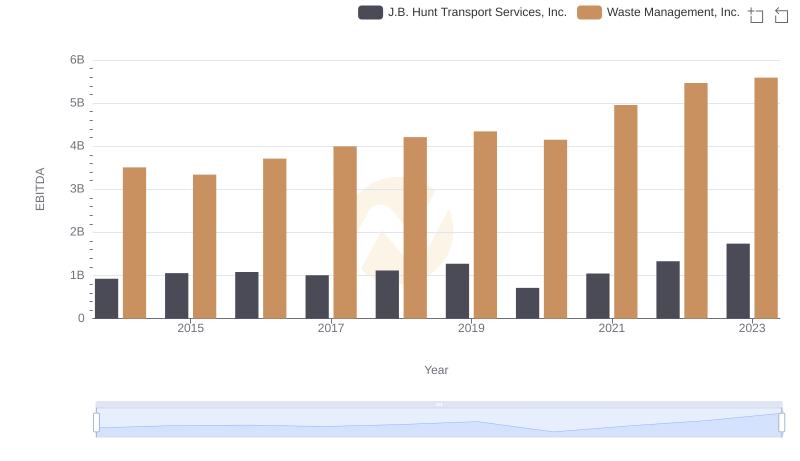
EBITDA Performance Review: Waste Management, Inc. vs J.B. Hunt Transport Services, Inc.
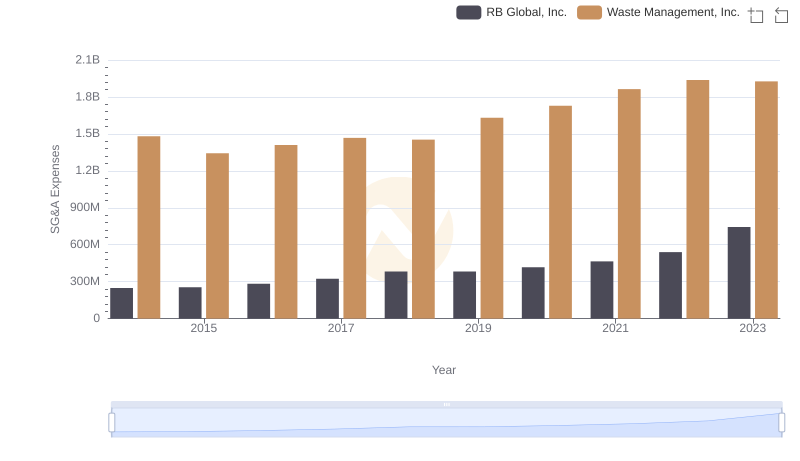
Cost Management Insights: SG&A Expenses for Waste Management, Inc. and RB Global, Inc.