| __timestamp | AerCap Holdings N.V. | Waste Management, Inc. |
|---|---|---|
| Wednesday, January 1, 2014 | 1282919000 | 4994000000 |
| Thursday, January 1, 2015 | 1822255000 | 4730000000 |
| Friday, January 1, 2016 | 1686404000 | 5123000000 |
| Sunday, January 1, 2017 | 1660054000 | 5464000000 |
| Monday, January 1, 2018 | 1500345000 | 5665000000 |
| Tuesday, January 1, 2019 | 1678249000 | 5959000000 |
| Wednesday, January 1, 2020 | 1276496000 | 5877000000 |
| Friday, January 1, 2021 | 1301517000 | 6820000000 |
| Saturday, January 1, 2022 | 2109708000 | 7404000000 |
| Sunday, January 1, 2023 | 4337648000 | 7820000000 |
| Monday, January 1, 2024 | 8680000000 |
In pursuit of knowledge
In the ever-evolving landscape of corporate finance, understanding the gross profit trends of industry giants like Waste Management, Inc. and AerCap Holdings N.V. offers valuable insights. Over the past decade, Waste Management has consistently outperformed AerCap in terms of gross profit, with a notable 30% increase from 2014 to 2023. In contrast, AerCap's gross profit saw a significant surge in 2023, nearly doubling from the previous year, indicating a potential strategic shift or market opportunity.
Waste Management's steady growth reflects its robust business model and market dominance in the waste management sector. Meanwhile, AerCap's recent spike suggests a dynamic response to market conditions, possibly driven by the aviation industry's recovery post-pandemic. This comparative analysis not only highlights the resilience of these companies but also underscores the importance of strategic adaptability in maintaining financial health.
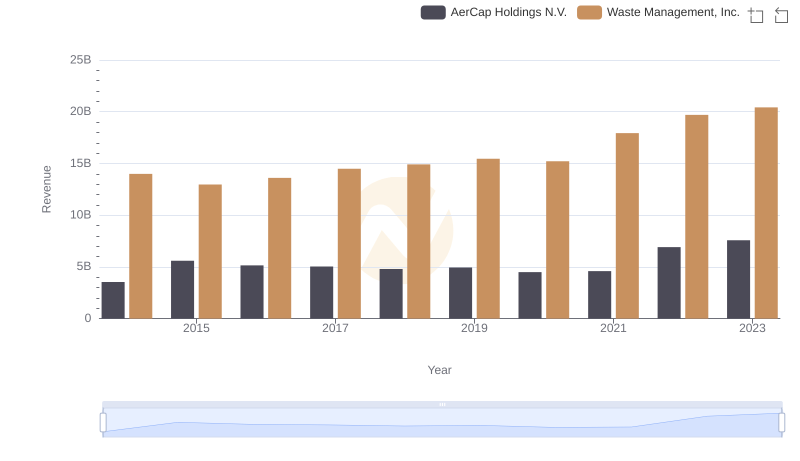
Annual Revenue Comparison: Waste Management, Inc. vs AerCap Holdings N.V.
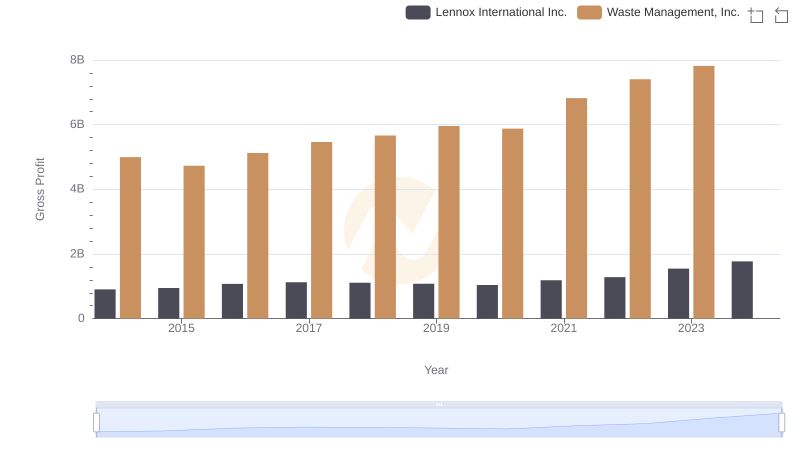
Gross Profit Comparison: Waste Management, Inc. and Lennox International Inc. Trends
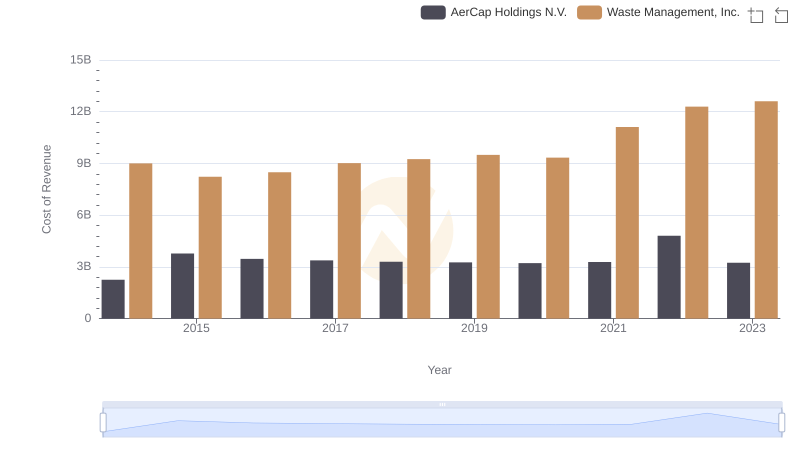
Cost of Revenue: Key Insights for Waste Management, Inc. and AerCap Holdings N.V.
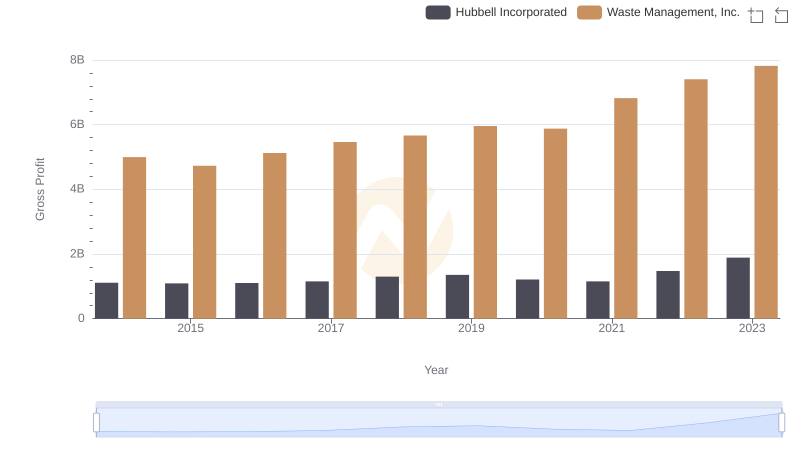
Waste Management, Inc. vs Hubbell Incorporated: A Gross Profit Performance Breakdown
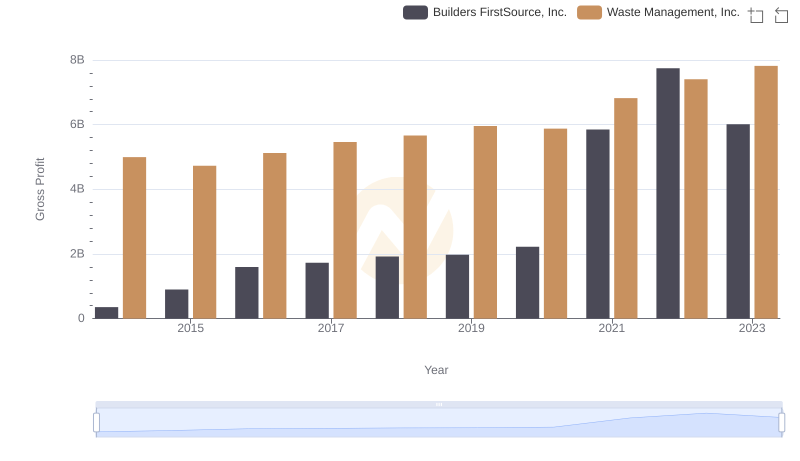
Gross Profit Comparison: Waste Management, Inc. and Builders FirstSource, Inc. Trends
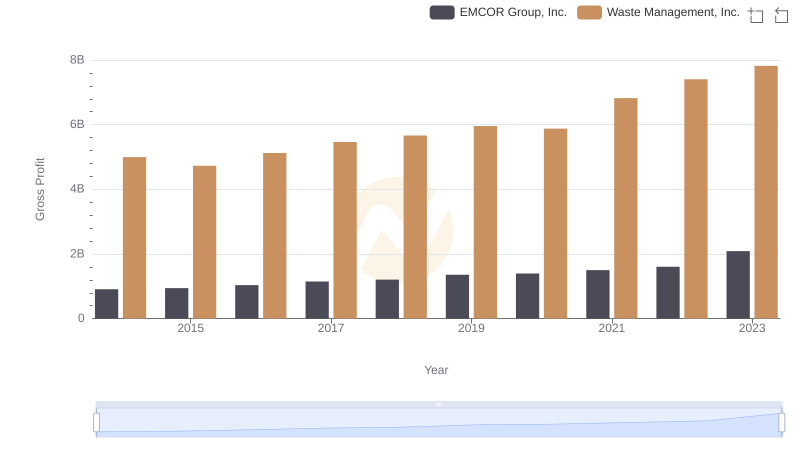
Gross Profit Analysis: Comparing Waste Management, Inc. and EMCOR Group, Inc.
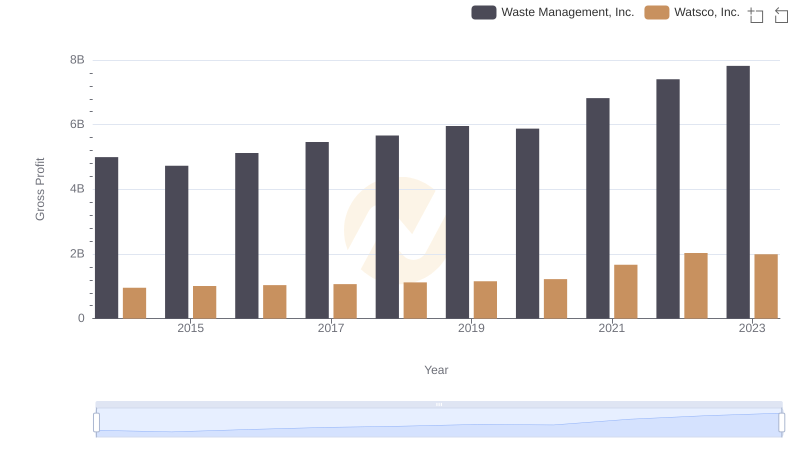
Who Generates Higher Gross Profit? Waste Management, Inc. or Watsco, Inc.
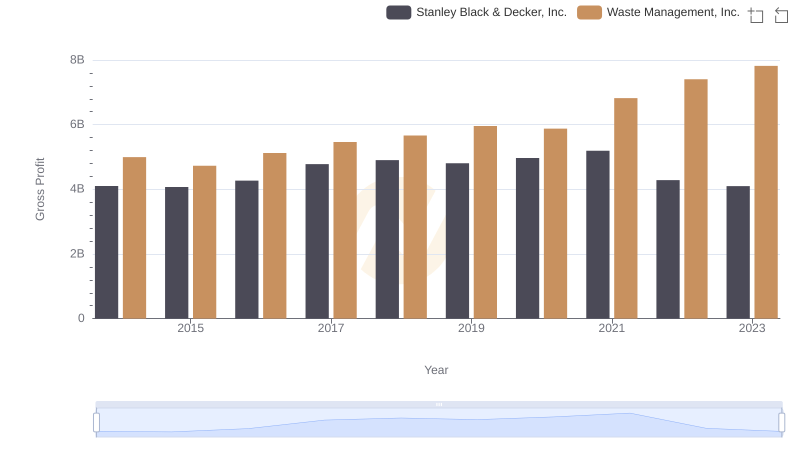
Gross Profit Comparison: Waste Management, Inc. and Stanley Black & Decker, Inc. Trends
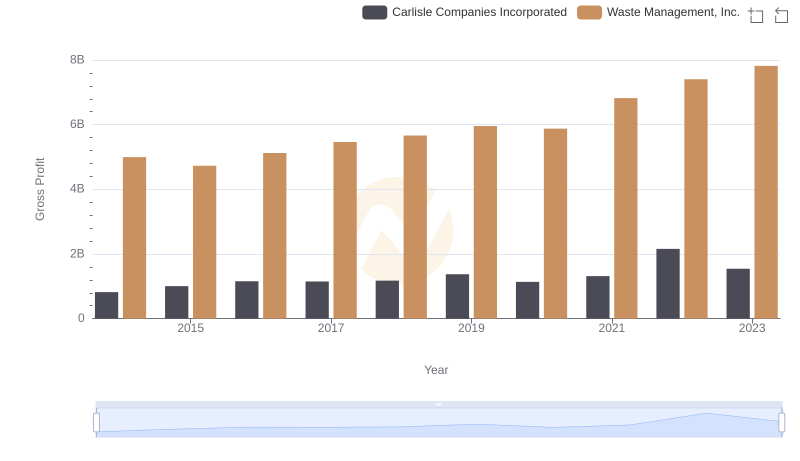
Gross Profit Analysis: Comparing Waste Management, Inc. and Carlisle Companies Incorporated
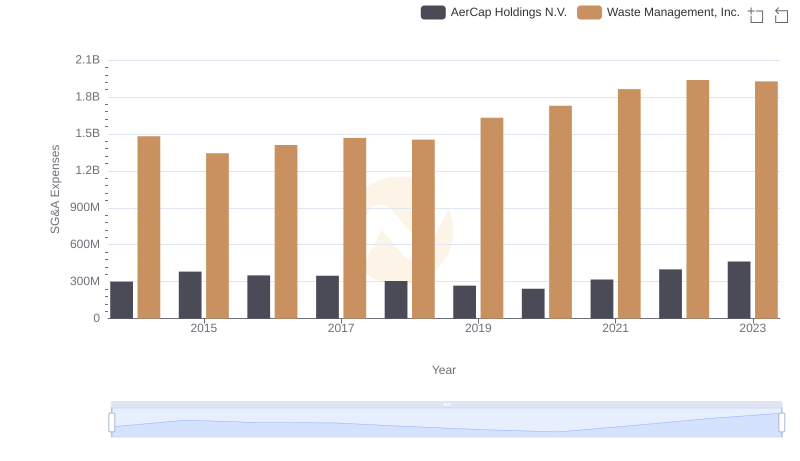
SG&A Efficiency Analysis: Comparing Waste Management, Inc. and AerCap Holdings N.V.
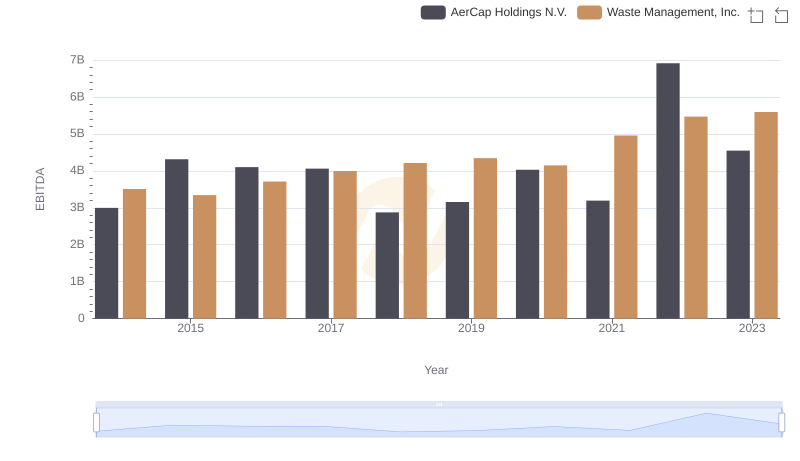
Professional EBITDA Benchmarking: Waste Management, Inc. vs AerCap Holdings N.V.