| __timestamp | EMCOR Group, Inc. | Waste Management, Inc. |
|---|---|---|
| Wednesday, January 1, 2014 | 626478000 | 1481000000 |
| Thursday, January 1, 2015 | 656573000 | 1343000000 |
| Friday, January 1, 2016 | 725538000 | 1410000000 |
| Sunday, January 1, 2017 | 757062000 | 1468000000 |
| Monday, January 1, 2018 | 799157000 | 1453000000 |
| Tuesday, January 1, 2019 | 893453000 | 1631000000 |
| Wednesday, January 1, 2020 | 903584000 | 1728000000 |
| Friday, January 1, 2021 | 970937000 | 1864000000 |
| Saturday, January 1, 2022 | 1038717000 | 1938000000 |
| Sunday, January 1, 2023 | 1211233000 | 1926000000 |
| Monday, January 1, 2024 | 2264000000 |
In pursuit of knowledge
In the world of corporate finance, understanding the nuances of Selling, General, and Administrative (SG&A) expenses is crucial. Over the past decade, Waste Management, Inc. and EMCOR Group, Inc. have showcased distinct spending patterns in this area. From 2014 to 2023, Waste Management's SG&A expenses have consistently outpaced those of EMCOR, with a peak in 2022 where they spent nearly 90% more than EMCOR. This trend highlights Waste Management's strategic focus on administrative and operational efficiency. Meanwhile, EMCOR has shown a steady increase, with a notable 93% rise in SG&A expenses over the same period. This growth reflects EMCOR's expanding operational footprint and investment in administrative capabilities. As these companies continue to evolve, their SG&A strategies will remain a key indicator of their financial health and market positioning.
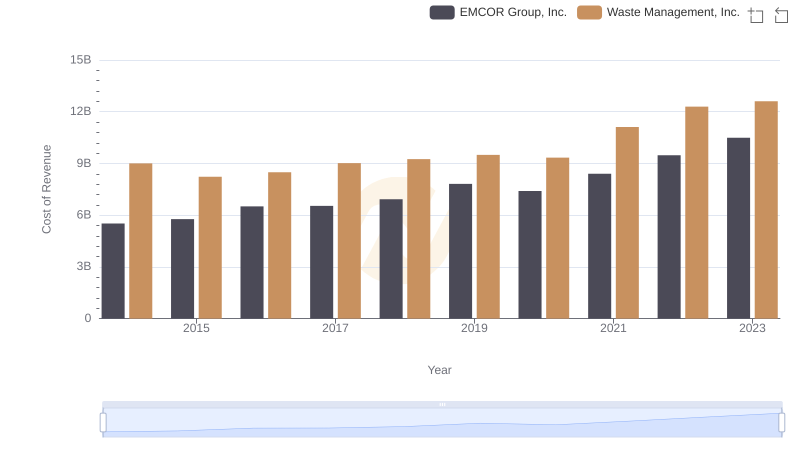
Cost Insights: Breaking Down Waste Management, Inc. and EMCOR Group, Inc.'s Expenses
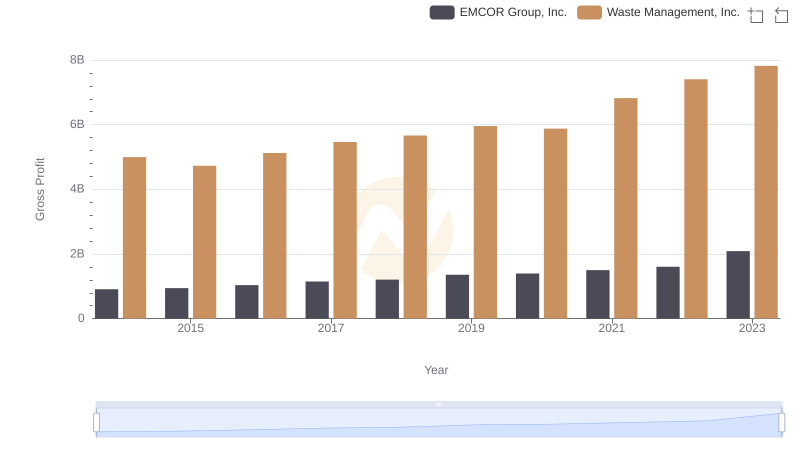
Gross Profit Analysis: Comparing Waste Management, Inc. and EMCOR Group, Inc.
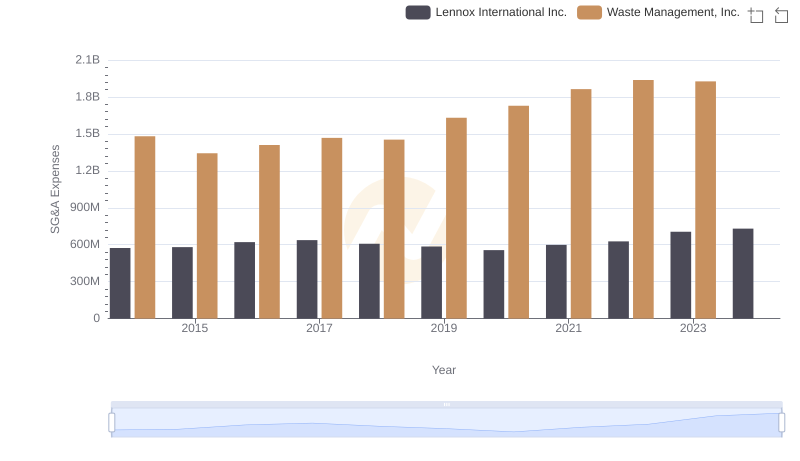
Waste Management, Inc. vs Lennox International Inc.: SG&A Expense Trends
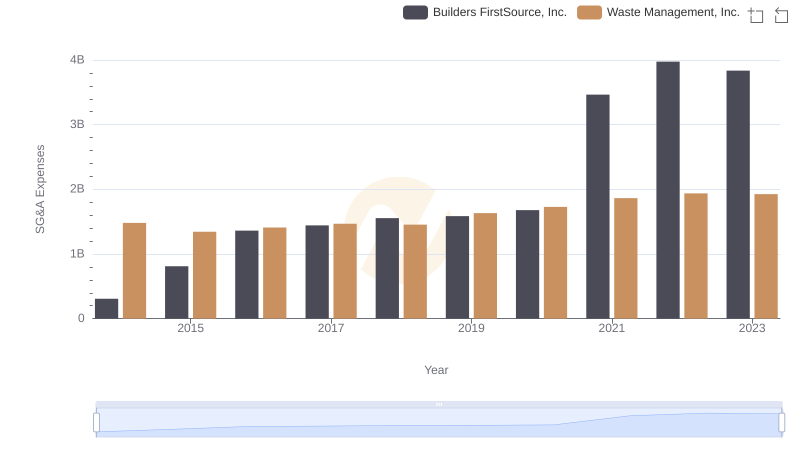
Who Optimizes SG&A Costs Better? Waste Management, Inc. or Builders FirstSource, Inc.
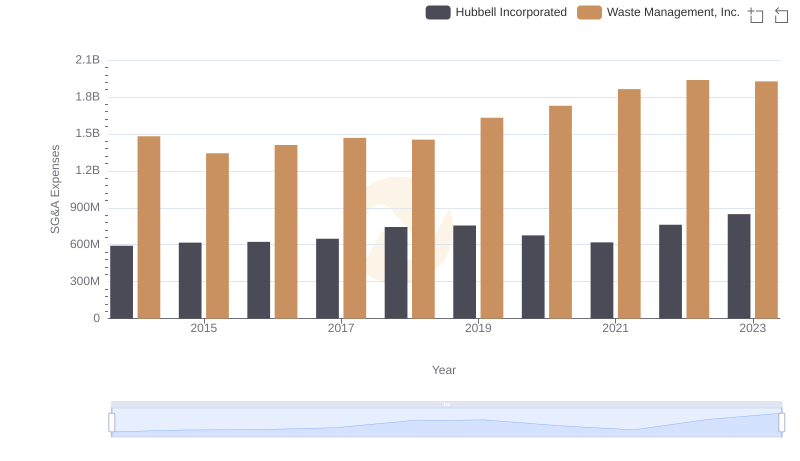
Waste Management, Inc. and Hubbell Incorporated: SG&A Spending Patterns Compared
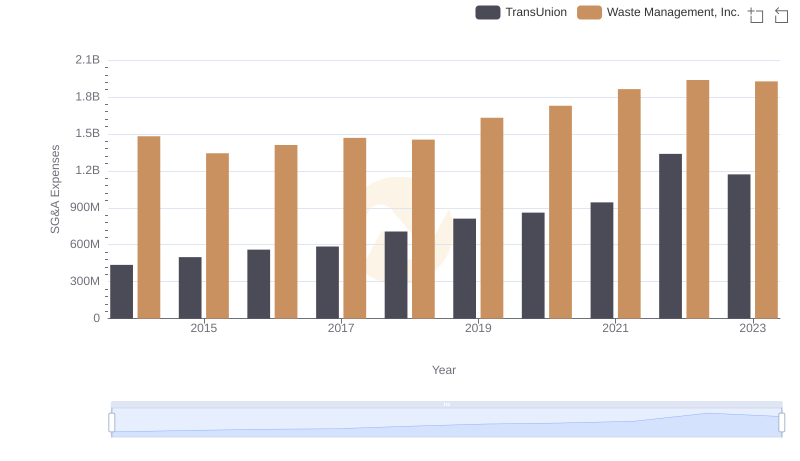
Breaking Down SG&A Expenses: Waste Management, Inc. vs TransUnion
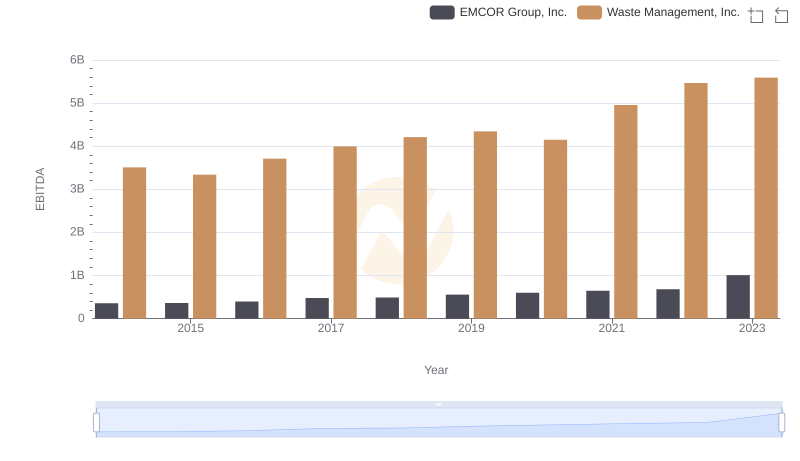
Comprehensive EBITDA Comparison: Waste Management, Inc. vs EMCOR Group, Inc.
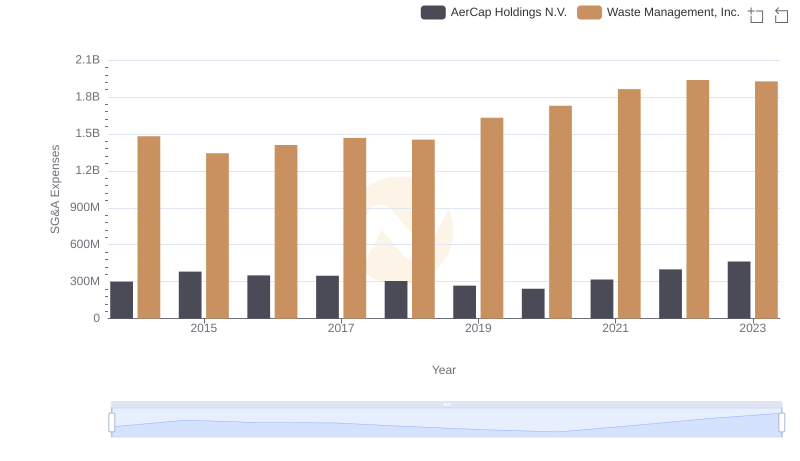
SG&A Efficiency Analysis: Comparing Waste Management, Inc. and AerCap Holdings N.V.