| __timestamp | AerCap Holdings N.V. | Waste Management, Inc. |
|---|---|---|
| Wednesday, January 1, 2014 | 2997442000 | 3509000000 |
| Thursday, January 1, 2015 | 4313510000 | 3342000000 |
| Friday, January 1, 2016 | 4101801000 | 3713000000 |
| Sunday, January 1, 2017 | 4061381000 | 3996000000 |
| Monday, January 1, 2018 | 2874193000 | 4212000000 |
| Tuesday, January 1, 2019 | 3157061000 | 4344000000 |
| Wednesday, January 1, 2020 | 4028661000 | 4149000000 |
| Friday, January 1, 2021 | 3192341000 | 4956000000 |
| Saturday, January 1, 2022 | 6911148000 | 5466000000 |
| Sunday, January 1, 2023 | 4547656000 | 5592000000 |
| Monday, January 1, 2024 | 5128000000 |
Igniting the spark of knowledge
In the ever-evolving landscape of corporate finance, EBITDA serves as a crucial metric for evaluating a company's operational performance. This analysis juxtaposes the EBITDA of Waste Management, Inc. and AerCap Holdings N.V. from 2014 to 2023. Over this period, Waste Management consistently demonstrated robust growth, with a peak EBITDA in 2023, marking a 59% increase from 2014. Meanwhile, AerCap Holdings experienced a more volatile trajectory, with a notable surge in 2022, achieving a 131% increase from its 2014 figures. This fluctuation underscores the dynamic nature of the aviation leasing industry compared to the relatively stable waste management sector. As we delve into these insights, it becomes evident that understanding industry-specific trends is vital for investors and stakeholders aiming to make informed decisions.
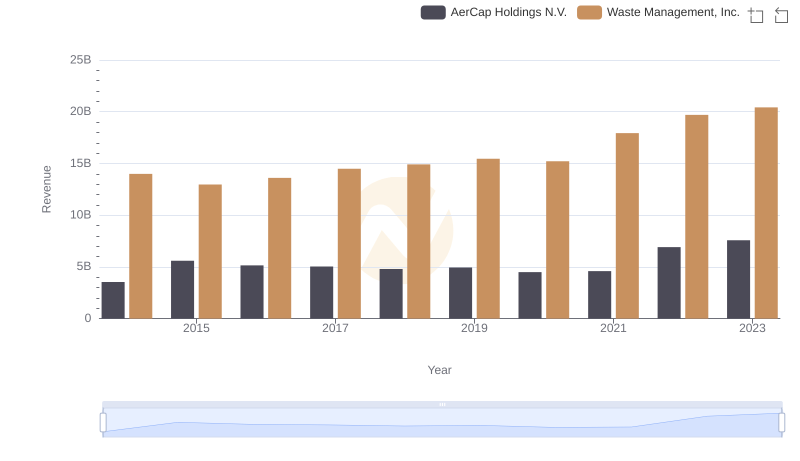
Annual Revenue Comparison: Waste Management, Inc. vs AerCap Holdings N.V.
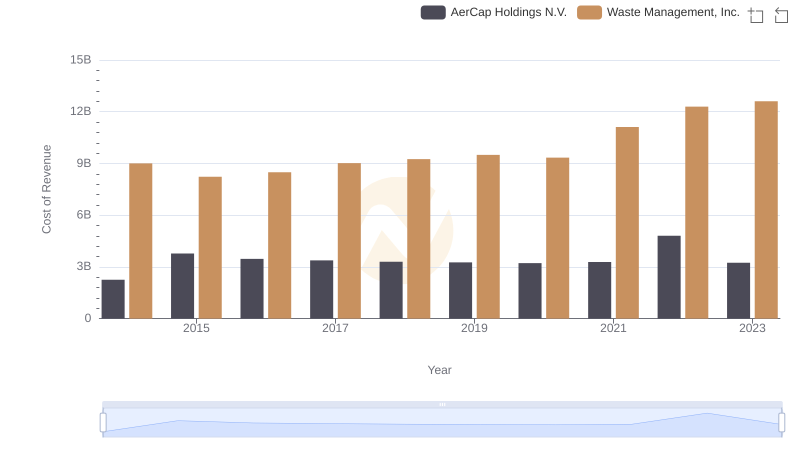
Cost of Revenue: Key Insights for Waste Management, Inc. and AerCap Holdings N.V.
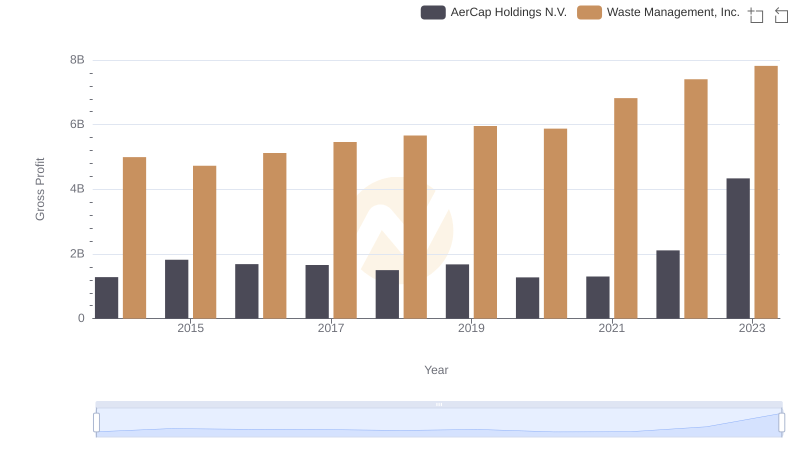
Gross Profit Analysis: Comparing Waste Management, Inc. and AerCap Holdings N.V.
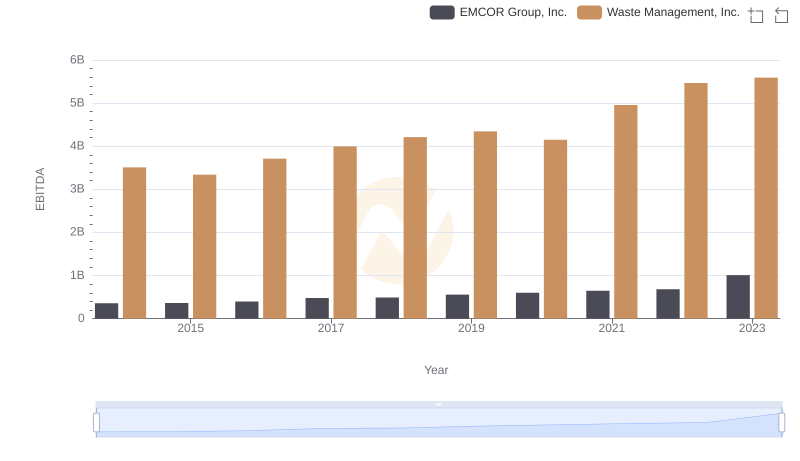
Comprehensive EBITDA Comparison: Waste Management, Inc. vs EMCOR Group, Inc.
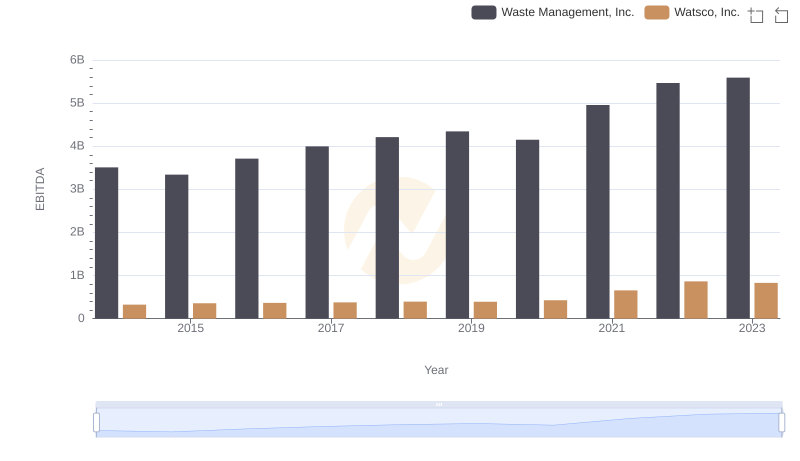
Professional EBITDA Benchmarking: Waste Management, Inc. vs Watsco, Inc.
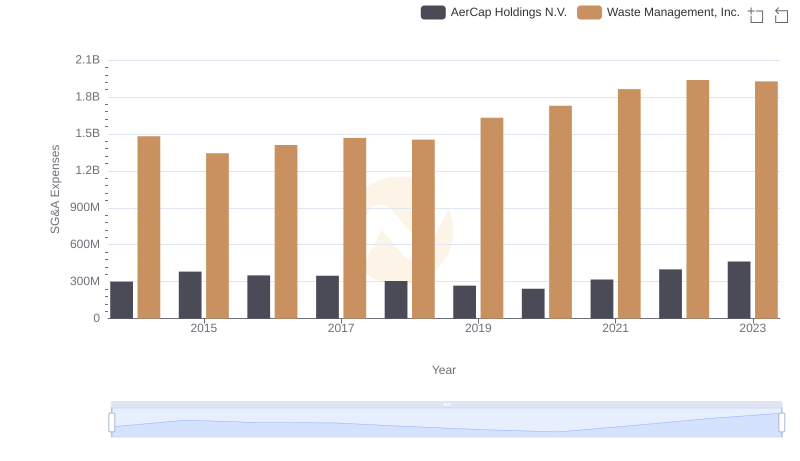
SG&A Efficiency Analysis: Comparing Waste Management, Inc. and AerCap Holdings N.V.
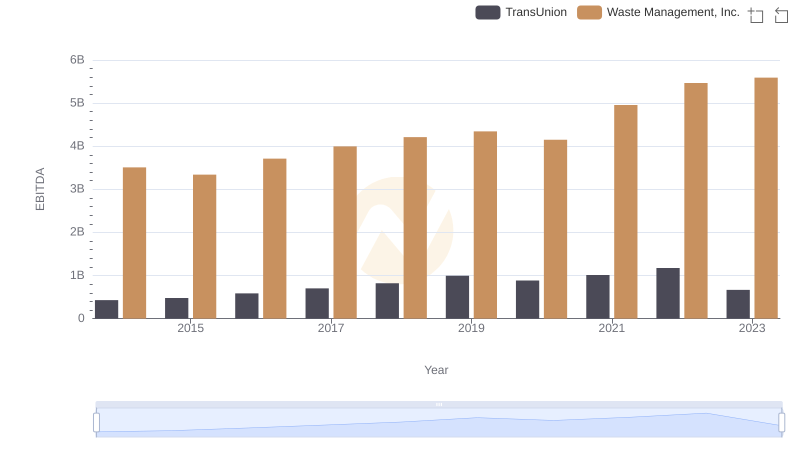
A Professional Review of EBITDA: Waste Management, Inc. Compared to TransUnion
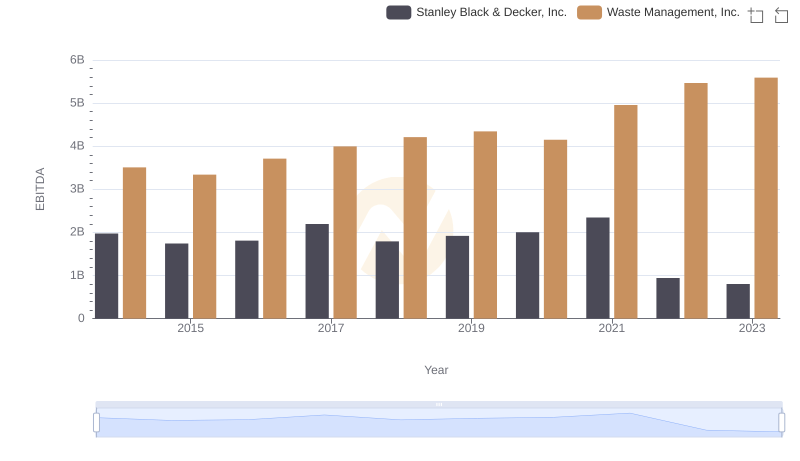
EBITDA Metrics Evaluated: Waste Management, Inc. vs Stanley Black & Decker, Inc.
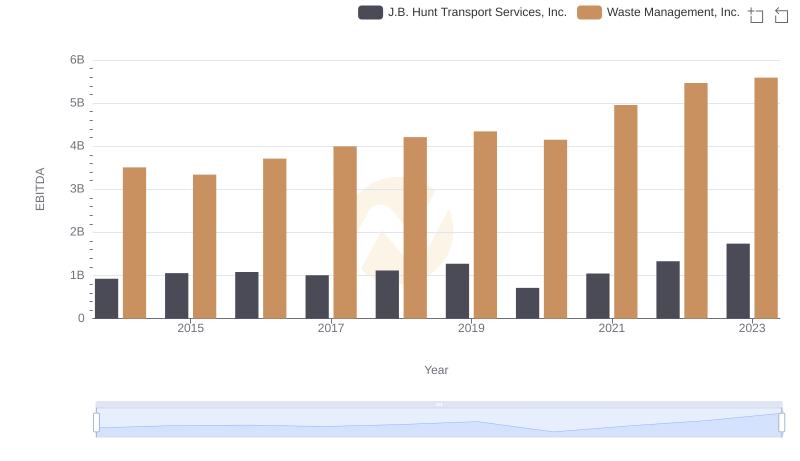
EBITDA Performance Review: Waste Management, Inc. vs J.B. Hunt Transport Services, Inc.