| __timestamp | TransUnion | Waste Management, Inc. |
|---|---|---|
| Wednesday, January 1, 2014 | 436000000 | 1481000000 |
| Thursday, January 1, 2015 | 499700000 | 1343000000 |
| Friday, January 1, 2016 | 560100000 | 1410000000 |
| Sunday, January 1, 2017 | 585400000 | 1468000000 |
| Monday, January 1, 2018 | 707700000 | 1453000000 |
| Tuesday, January 1, 2019 | 812100000 | 1631000000 |
| Wednesday, January 1, 2020 | 860300000 | 1728000000 |
| Friday, January 1, 2021 | 943900000 | 1864000000 |
| Saturday, January 1, 2022 | 1337400000 | 1938000000 |
| Sunday, January 1, 2023 | 1171600000 | 1926000000 |
| Monday, January 1, 2024 | 1239300000 | 2264000000 |
In pursuit of knowledge
In the world of corporate finance, Selling, General, and Administrative (SG&A) expenses are a critical measure of a company's operational efficiency. Waste Management, Inc. and TransUnion, two industry leaders, have shown distinct trends in their SG&A expenses over the past decade. From 2014 to 2023, Waste Management's SG&A expenses have consistently been higher, peaking at nearly 1.93 billion in 2022. This represents a steady increase of about 30% from 2014. Meanwhile, TransUnion's expenses have surged by over 150%, reaching a high of 1.34 billion in 2022. This sharp rise reflects TransUnion's aggressive growth strategies and market expansion efforts. The data highlights the contrasting financial strategies of these two companies, offering valuable insights into their operational priorities and market positioning. As businesses navigate the complexities of the modern economy, understanding these trends is crucial for investors and analysts alike.
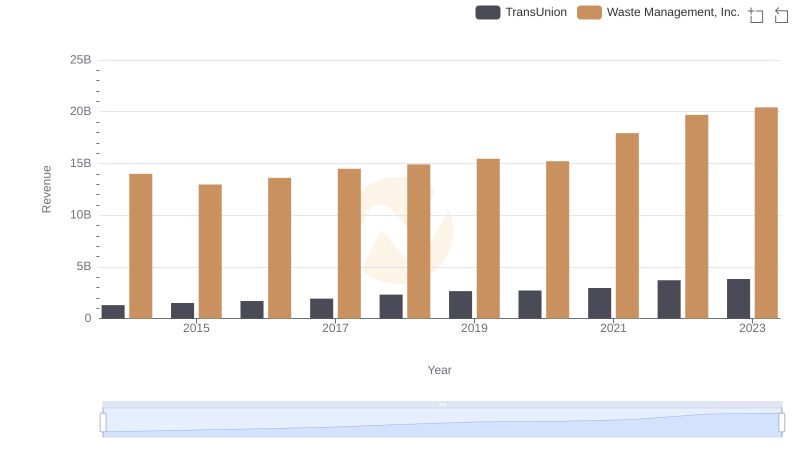
Waste Management, Inc. and TransUnion: A Comprehensive Revenue Analysis
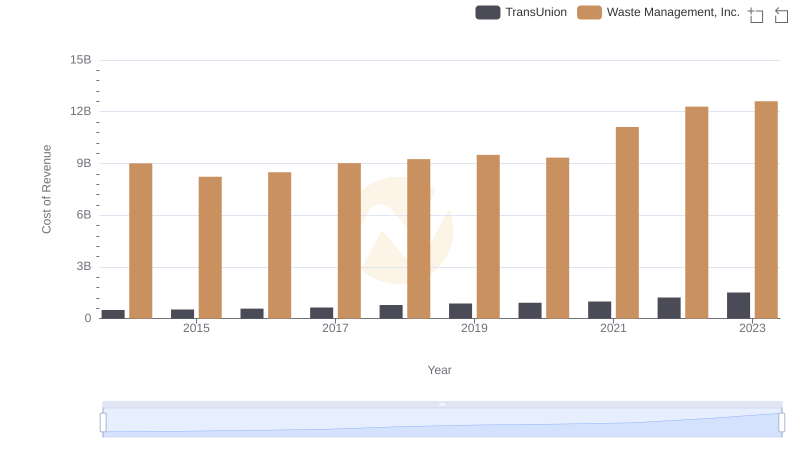
Analyzing Cost of Revenue: Waste Management, Inc. and TransUnion
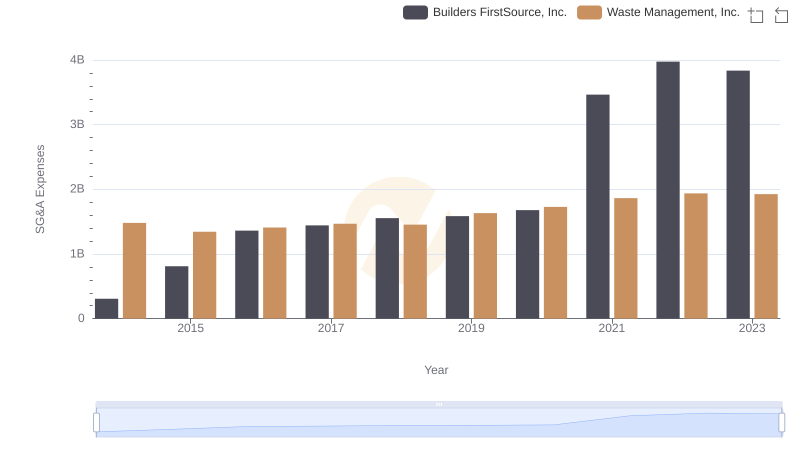
Who Optimizes SG&A Costs Better? Waste Management, Inc. or Builders FirstSource, Inc.
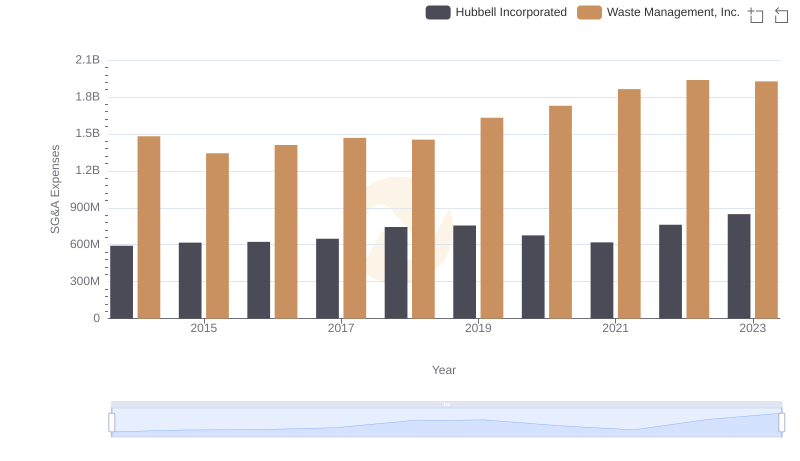
Waste Management, Inc. and Hubbell Incorporated: SG&A Spending Patterns Compared
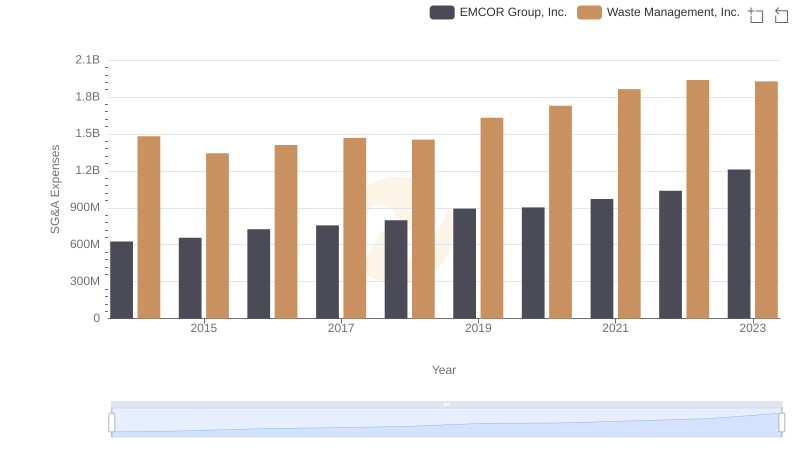
Waste Management, Inc. and EMCOR Group, Inc.: SG&A Spending Patterns Compared
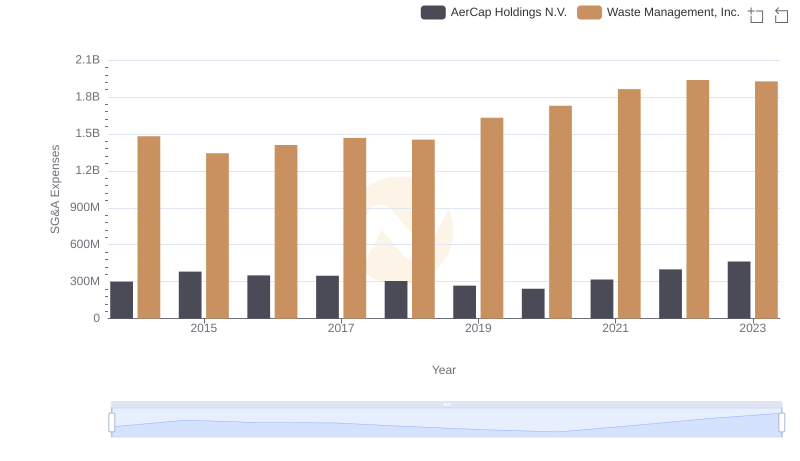
SG&A Efficiency Analysis: Comparing Waste Management, Inc. and AerCap Holdings N.V.
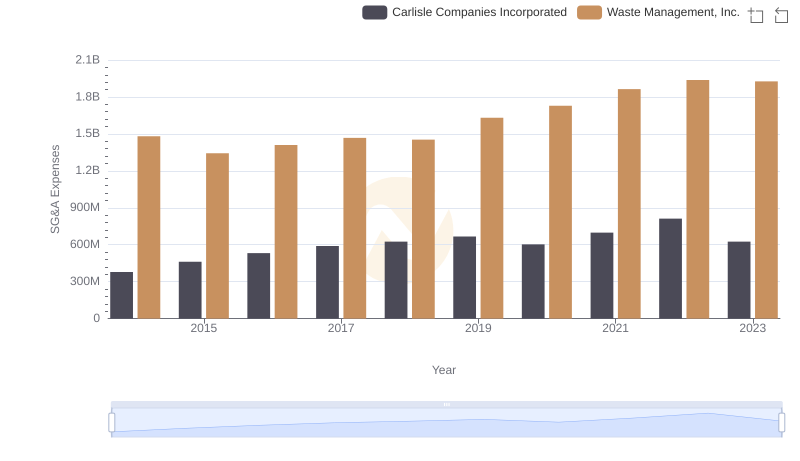
Breaking Down SG&A Expenses: Waste Management, Inc. vs Carlisle Companies Incorporated
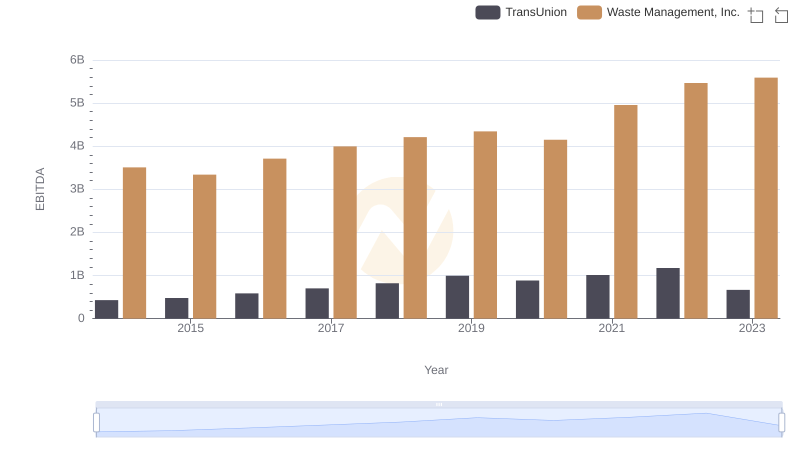
A Professional Review of EBITDA: Waste Management, Inc. Compared to TransUnion