| __timestamp | Hubbell Incorporated | Waste Management, Inc. |
|---|---|---|
| Wednesday, January 1, 2014 | 591600000 | 1481000000 |
| Thursday, January 1, 2015 | 617200000 | 1343000000 |
| Friday, January 1, 2016 | 622900000 | 1410000000 |
| Sunday, January 1, 2017 | 648200000 | 1468000000 |
| Monday, January 1, 2018 | 743500000 | 1453000000 |
| Tuesday, January 1, 2019 | 756100000 | 1631000000 |
| Wednesday, January 1, 2020 | 676300000 | 1728000000 |
| Friday, January 1, 2021 | 619200000 | 1864000000 |
| Saturday, January 1, 2022 | 762500000 | 1938000000 |
| Sunday, January 1, 2023 | 848600000 | 1926000000 |
| Monday, January 1, 2024 | 812500000 | 2264000000 |
Unlocking the unknown
In the world of corporate finance, understanding the spending patterns of industry leaders can offer valuable insights. Waste Management, Inc. and Hubbell Incorporated, two stalwarts in their respective fields, have shown distinct trends in their Selling, General, and Administrative (SG&A) expenses over the past decade.
From 2014 to 2023, Waste Management's SG&A expenses have consistently outpaced those of Hubbell, with a notable increase of approximately 30% over the period. In contrast, Hubbell's expenses grew by about 43%, reflecting a more aggressive expansion strategy. By 2023, Waste Management's SG&A expenses were nearly double those of Hubbell, highlighting their larger operational scale.
These trends underscore the strategic priorities of each company, with Waste Management focusing on maintaining its market dominance, while Hubbell appears to be investing in growth and innovation.
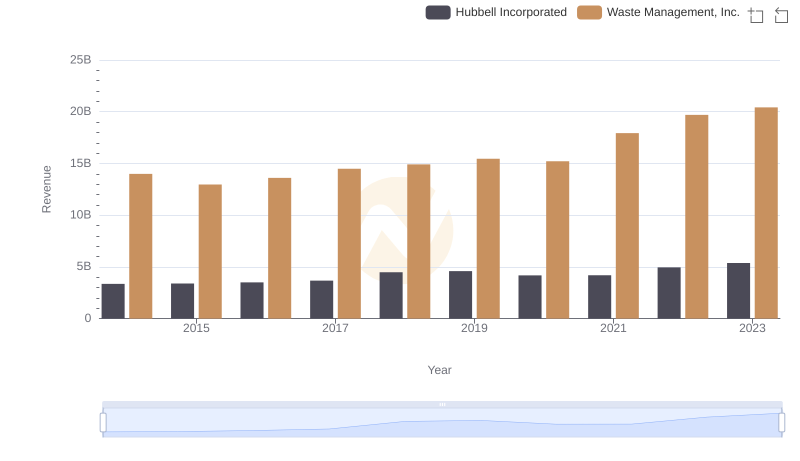
Waste Management, Inc. vs Hubbell Incorporated: Annual Revenue Growth Compared
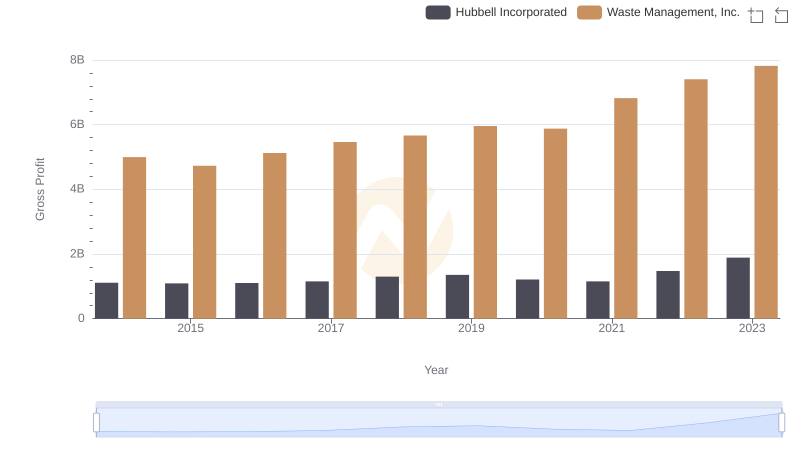
Waste Management, Inc. vs Hubbell Incorporated: A Gross Profit Performance Breakdown
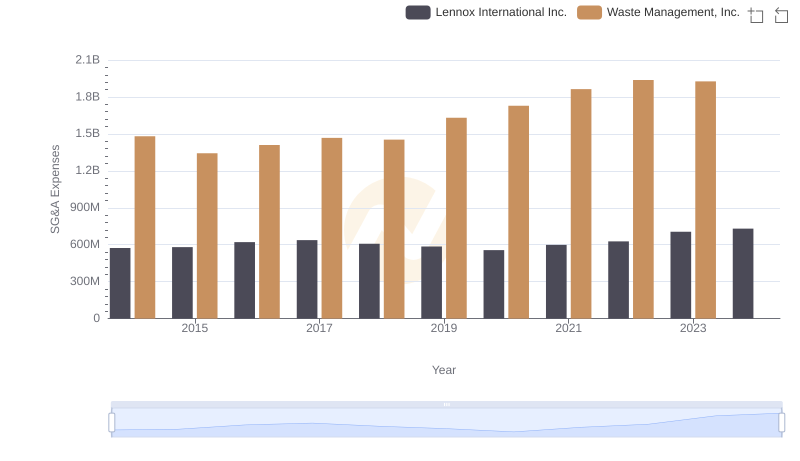
Waste Management, Inc. vs Lennox International Inc.: SG&A Expense Trends
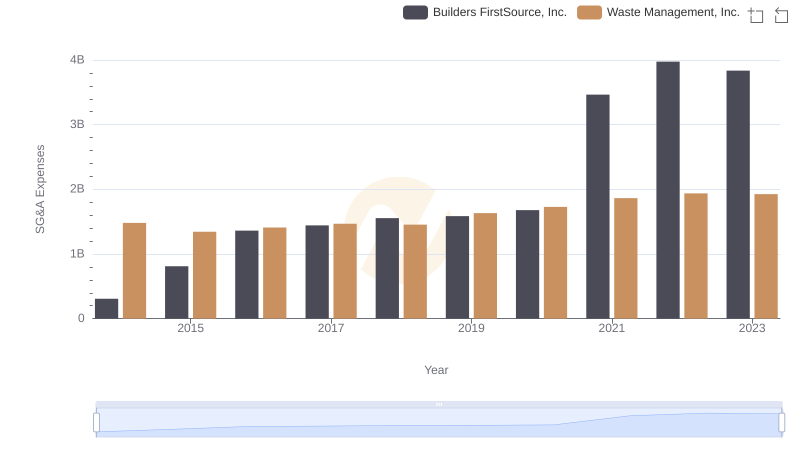
Who Optimizes SG&A Costs Better? Waste Management, Inc. or Builders FirstSource, Inc.
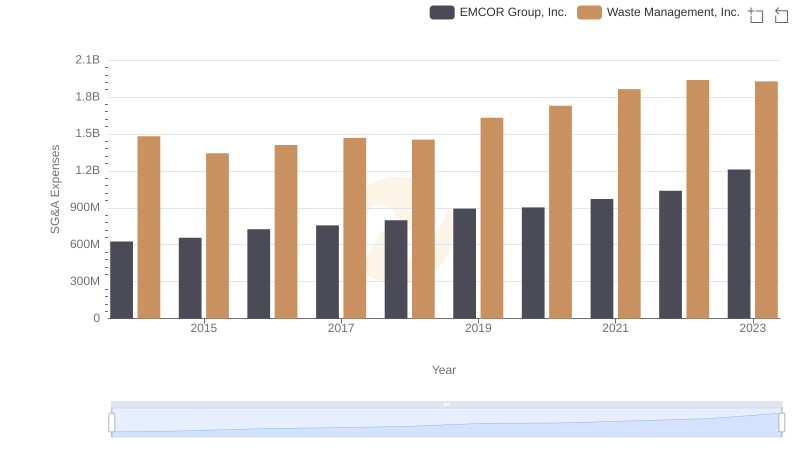
Waste Management, Inc. and EMCOR Group, Inc.: SG&A Spending Patterns Compared
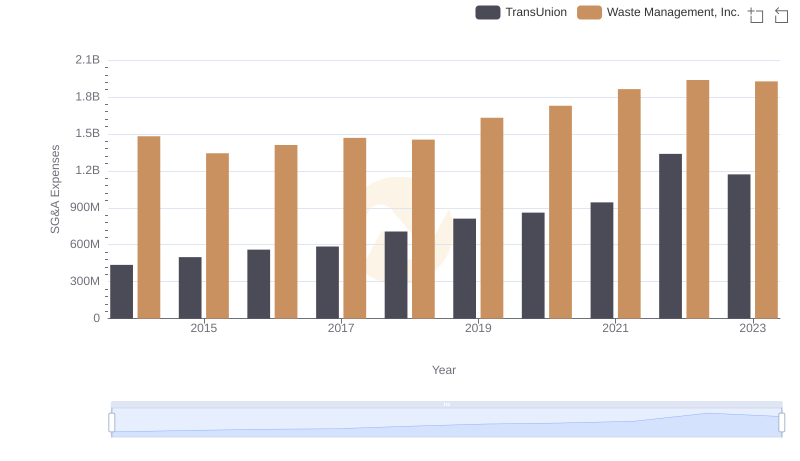
Breaking Down SG&A Expenses: Waste Management, Inc. vs TransUnion