| __timestamp | AerCap Holdings N.V. | Waste Management, Inc. |
|---|---|---|
| Wednesday, January 1, 2014 | 2252878000 | 9002000000 |
| Thursday, January 1, 2015 | 3776407000 | 8231000000 |
| Friday, January 1, 2016 | 3465727000 | 8486000000 |
| Sunday, January 1, 2017 | 3377439000 | 9021000000 |
| Monday, January 1, 2018 | 3299635000 | 9249000000 |
| Tuesday, January 1, 2019 | 3259091000 | 9496000000 |
| Wednesday, January 1, 2020 | 3217133000 | 9341000000 |
| Friday, January 1, 2021 | 3287413000 | 11111000000 |
| Saturday, January 1, 2022 | 4805277000 | 12294000000 |
| Sunday, January 1, 2023 | 3237016000 | 12606000000 |
| Monday, January 1, 2024 | 13383000000 |
Unlocking the unknown
In the ever-evolving landscape of corporate finance, understanding the cost of revenue is crucial for evaluating a company's efficiency and profitability. Over the past decade, Waste Management, Inc. and AerCap Holdings N.V. have demonstrated distinct trajectories in their cost of revenue. From 2014 to 2023, Waste Management, Inc. has seen a steady increase, peaking at approximately $12.6 billion in 2023, reflecting a growth of nearly 40% from 2014. This trend underscores the company's expanding operations and market dominance in waste management services.
Conversely, AerCap Holdings N.V. experienced fluctuations, with a notable spike in 2022, reaching around $4.8 billion, before settling back to $3.2 billion in 2023. This volatility highlights the challenges faced by the aviation leasing industry, particularly in the wake of global economic shifts. These insights provide a window into the strategic maneuvers and market conditions influencing these industry giants.
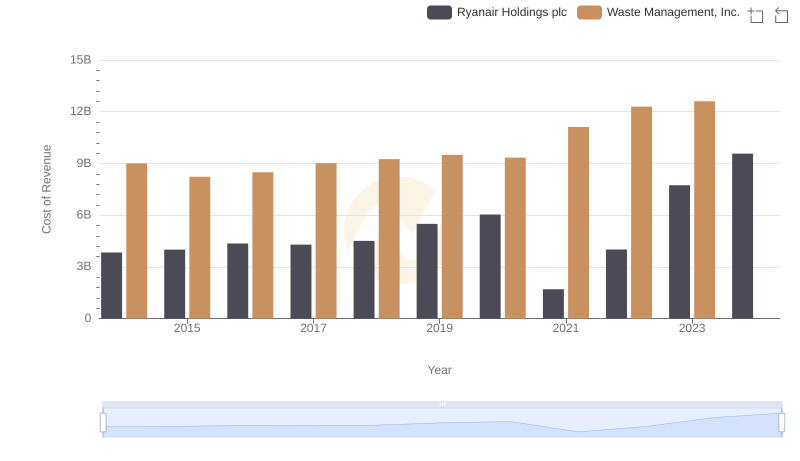
Cost Insights: Breaking Down Waste Management, Inc. and Ryanair Holdings plc's Expenses
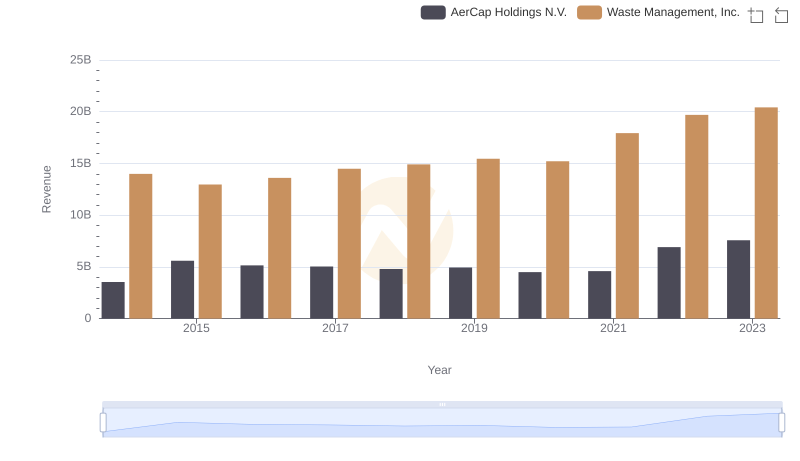
Annual Revenue Comparison: Waste Management, Inc. vs AerCap Holdings N.V.
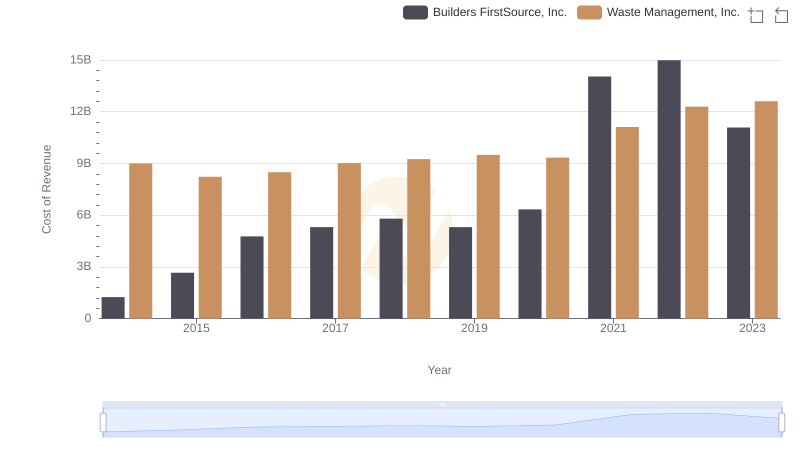
Cost Insights: Breaking Down Waste Management, Inc. and Builders FirstSource, Inc.'s Expenses
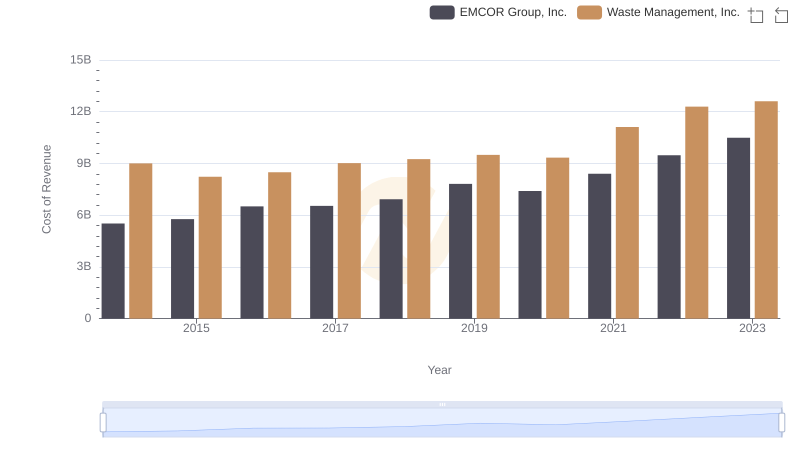
Cost Insights: Breaking Down Waste Management, Inc. and EMCOR Group, Inc.'s Expenses
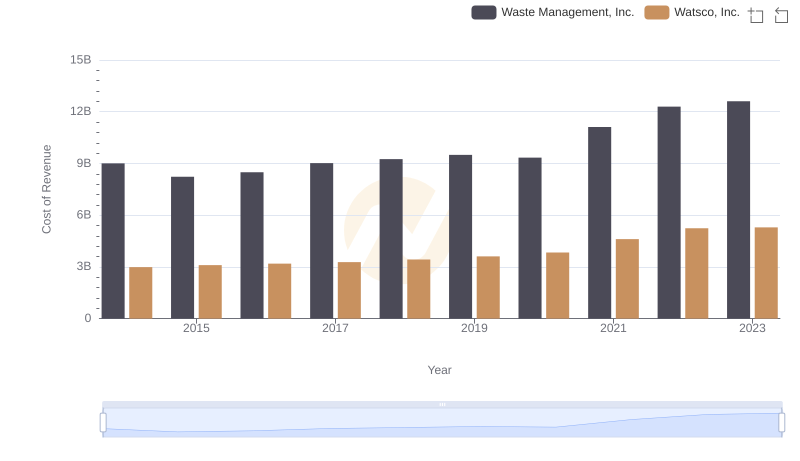
Cost of Revenue Comparison: Waste Management, Inc. vs Watsco, Inc.
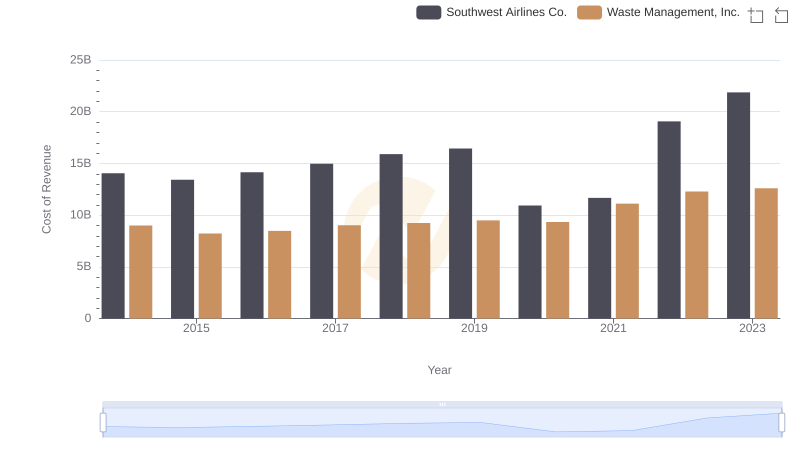
Cost of Revenue Comparison: Waste Management, Inc. vs Southwest Airlines Co.
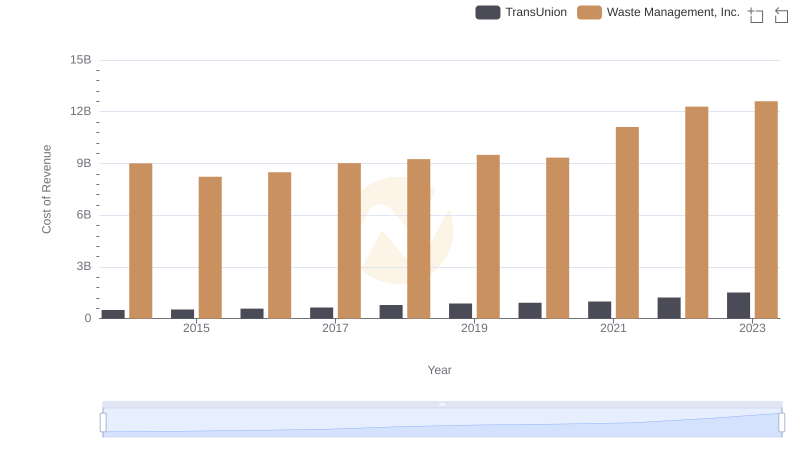
Analyzing Cost of Revenue: Waste Management, Inc. and TransUnion
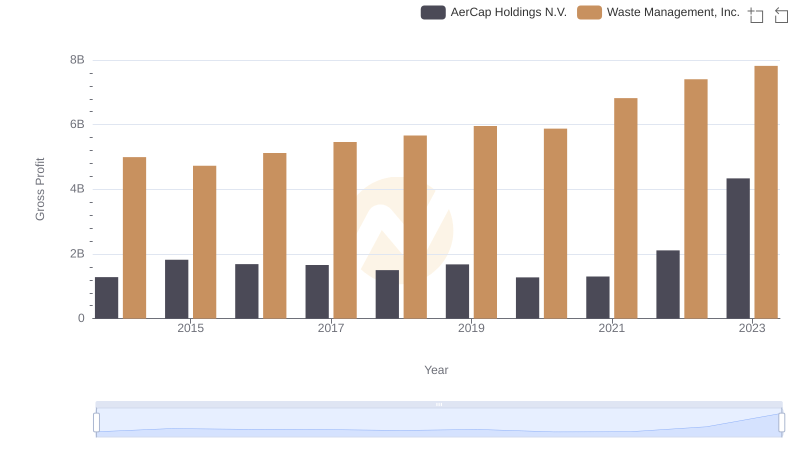
Gross Profit Analysis: Comparing Waste Management, Inc. and AerCap Holdings N.V.
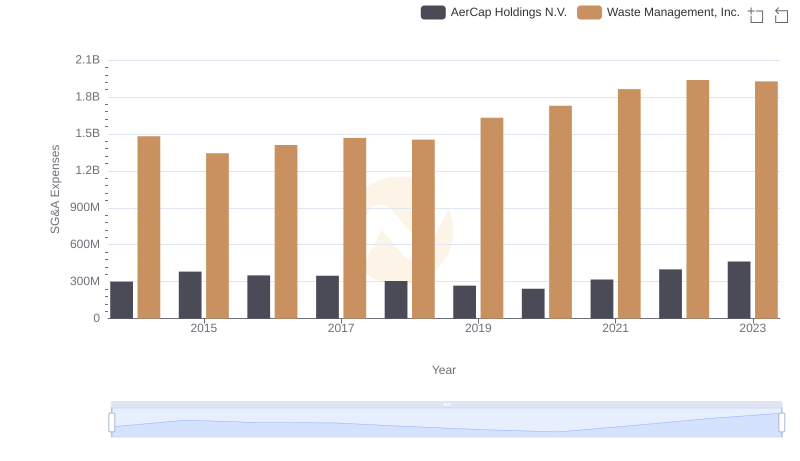
SG&A Efficiency Analysis: Comparing Waste Management, Inc. and AerCap Holdings N.V.
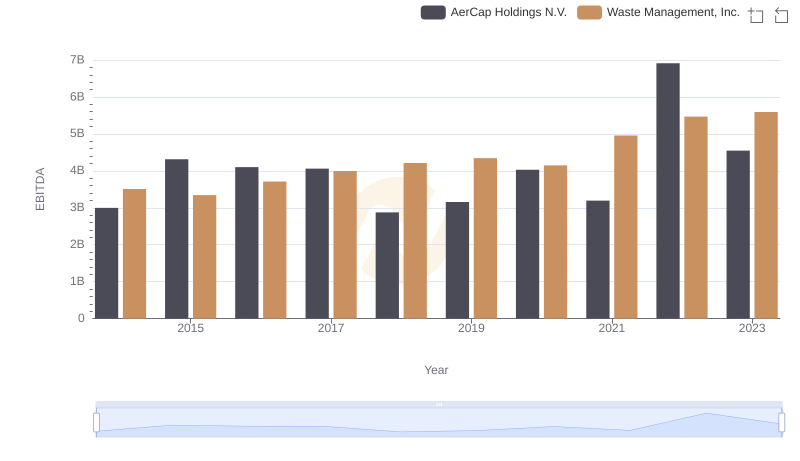
Professional EBITDA Benchmarking: Waste Management, Inc. vs AerCap Holdings N.V.