| __timestamp | Jacobs Engineering Group Inc. | Lennox International Inc. |
|---|---|---|
| Wednesday, January 1, 2014 | 1545716000 | 573700000 |
| Thursday, January 1, 2015 | 1522811000 | 580500000 |
| Friday, January 1, 2016 | 1429233000 | 621000000 |
| Sunday, January 1, 2017 | 1379983000 | 637700000 |
| Monday, January 1, 2018 | 2180399000 | 608200000 |
| Tuesday, January 1, 2019 | 2072177000 | 585900000 |
| Wednesday, January 1, 2020 | 2050695000 | 555900000 |
| Friday, January 1, 2021 | 2355683000 | 598900000 |
| Saturday, January 1, 2022 | 2409190000 | 627200000 |
| Sunday, January 1, 2023 | 2398078000 | 705500000 |
| Monday, January 1, 2024 | 2140320000 | 730600000 |
Cracking the code
In the competitive landscape of corporate America, managing Selling, General, and Administrative (SG&A) expenses is crucial for maintaining profitability. This analysis delves into the SG&A efficiency of two industry titans: Lennox International Inc. and Jacobs Engineering Group Inc., from 2014 to 2024.
Over the past decade, Jacobs Engineering Group Inc. has demonstrated a robust approach to managing its SG&A expenses, with a notable increase of approximately 55% from 2014 to 2023. In contrast, Lennox International Inc. has shown a more modest growth of around 23% in the same period.
While Jacobs Engineering's SG&A expenses peaked in 2022, Lennox International's expenses have steadily risen, reaching their highest in 2024. This trend suggests differing strategic priorities, with Jacobs focusing on operational efficiency and Lennox potentially investing in growth initiatives.
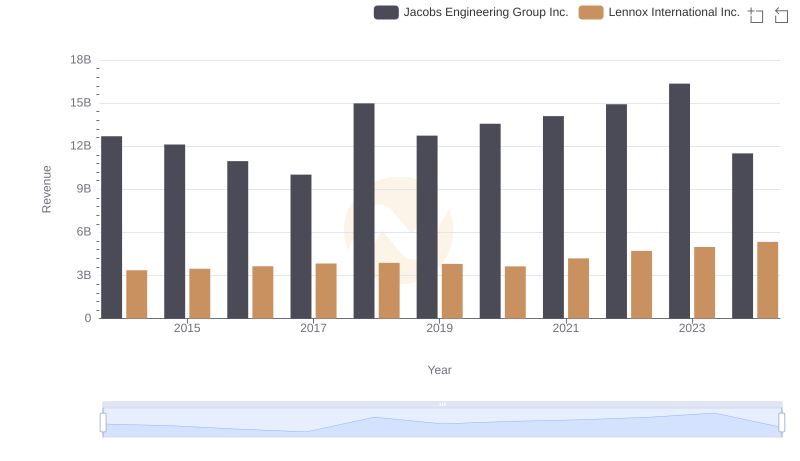
Revenue Showdown: Lennox International Inc. vs Jacobs Engineering Group Inc.
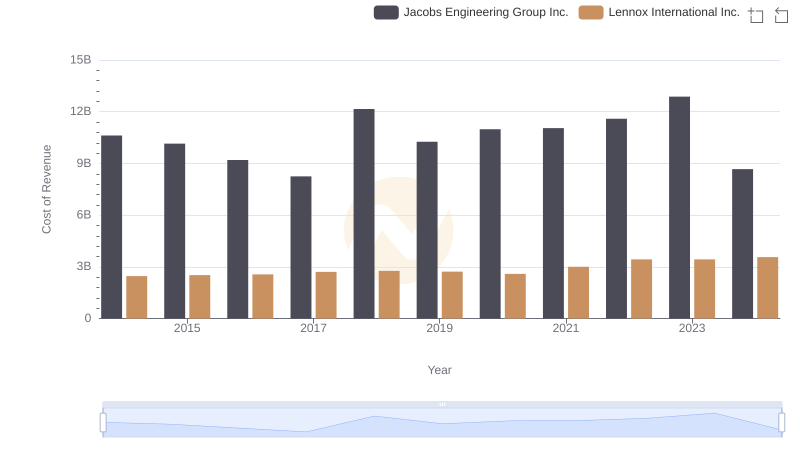
Cost of Revenue Trends: Lennox International Inc. vs Jacobs Engineering Group Inc.
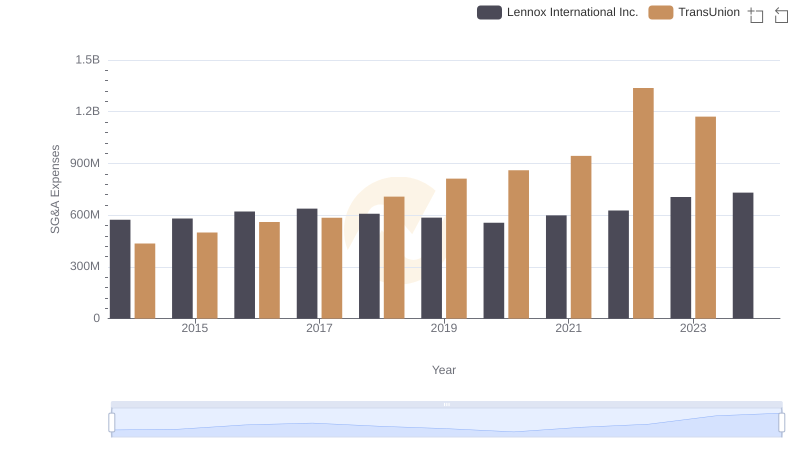
SG&A Efficiency Analysis: Comparing Lennox International Inc. and TransUnion
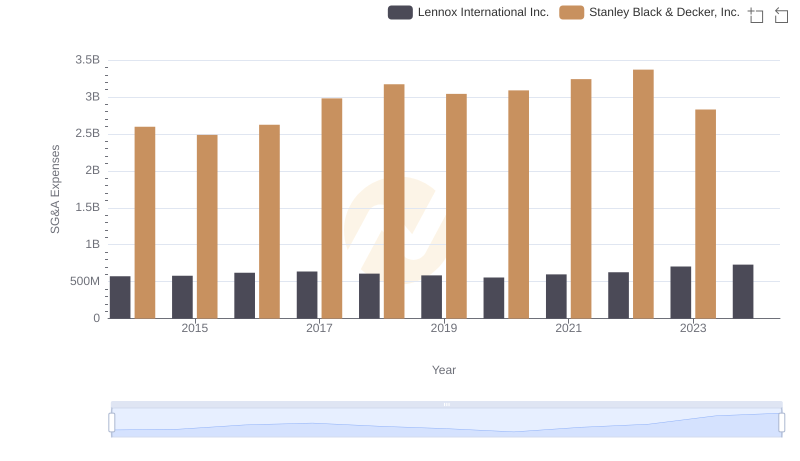
Who Optimizes SG&A Costs Better? Lennox International Inc. or Stanley Black & Decker, Inc.
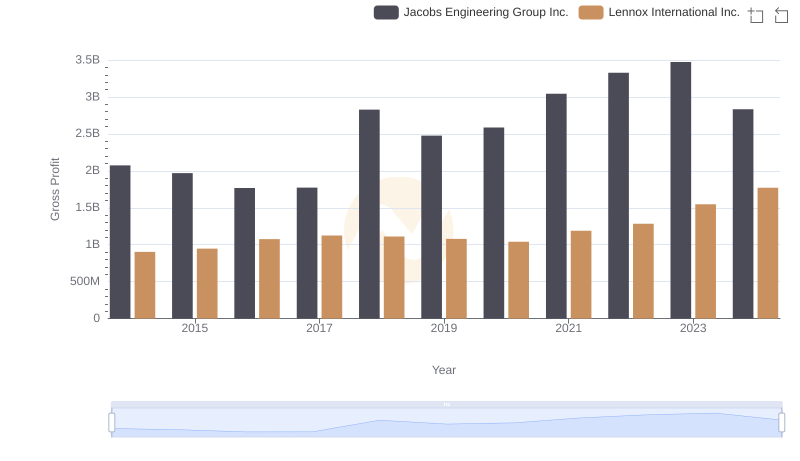
Who Generates Higher Gross Profit? Lennox International Inc. or Jacobs Engineering Group Inc.
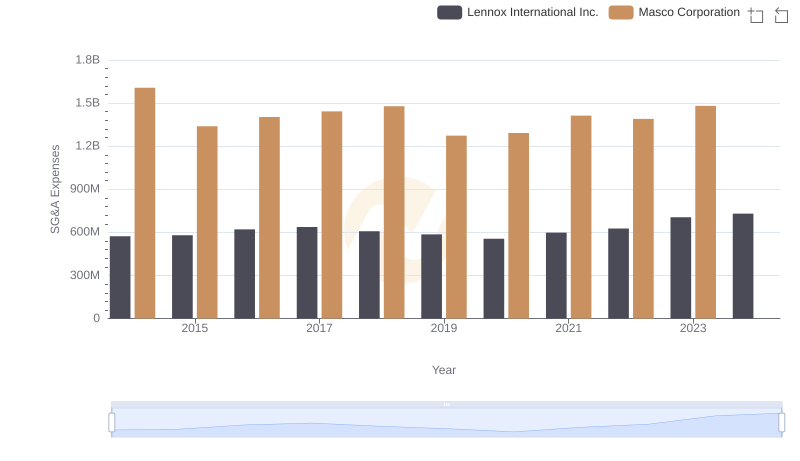
Lennox International Inc. or Masco Corporation: Who Manages SG&A Costs Better?
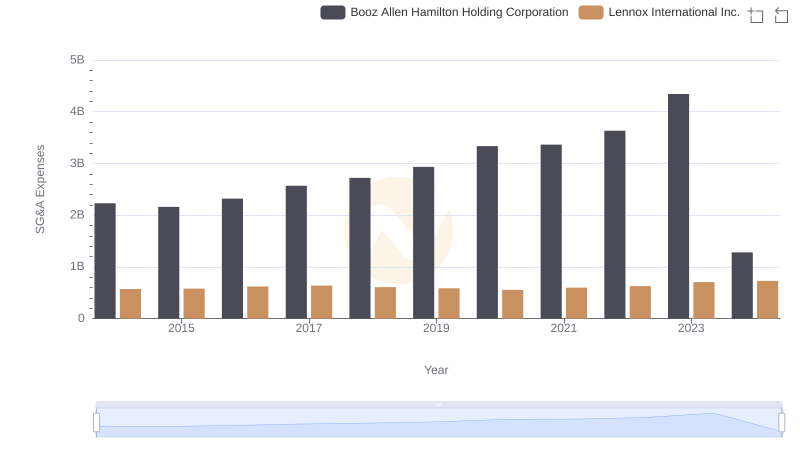
Selling, General, and Administrative Costs: Lennox International Inc. vs Booz Allen Hamilton Holding Corporation
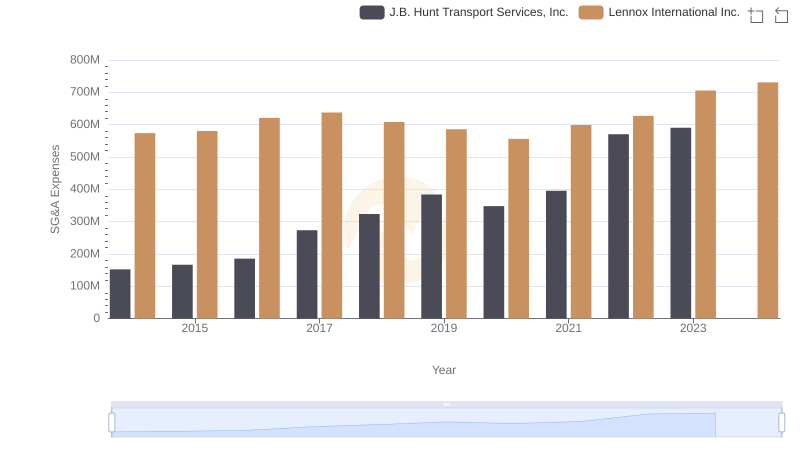
SG&A Efficiency Analysis: Comparing Lennox International Inc. and J.B. Hunt Transport Services, Inc.
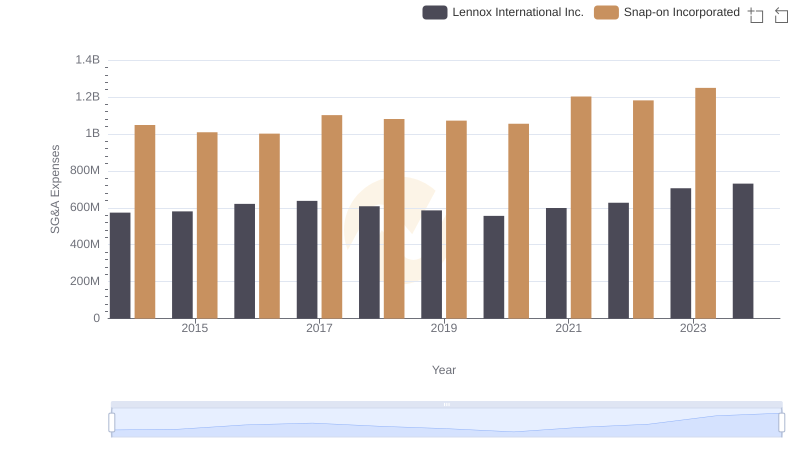
Breaking Down SG&A Expenses: Lennox International Inc. vs Snap-on Incorporated
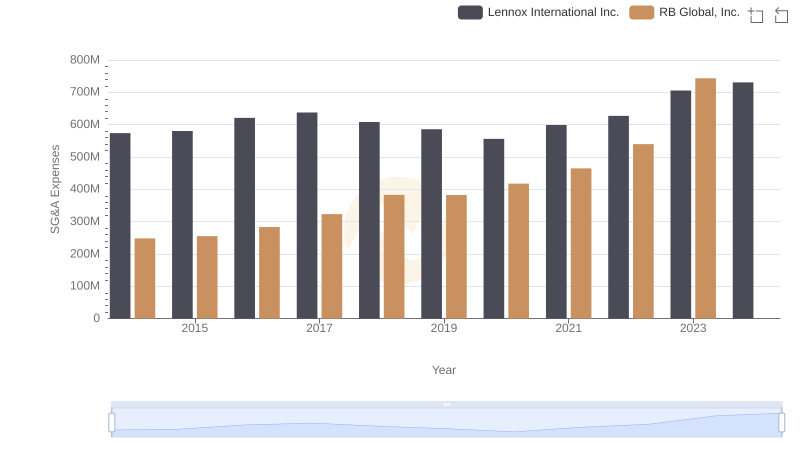
Operational Costs Compared: SG&A Analysis of Lennox International Inc. and RB Global, Inc.
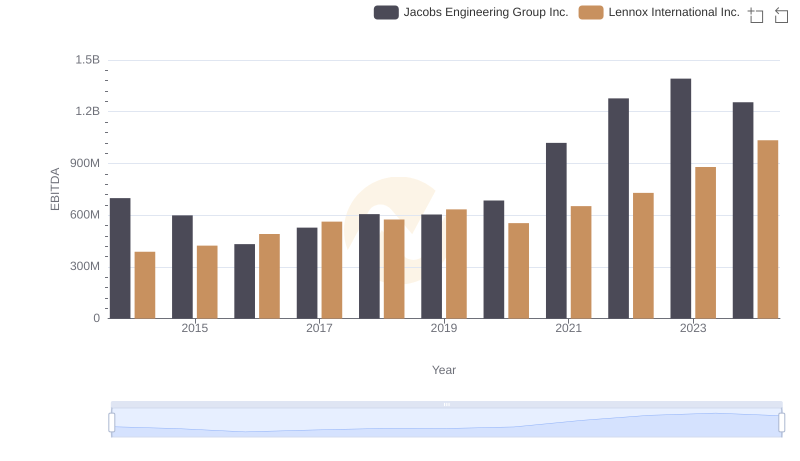
Lennox International Inc. and Jacobs Engineering Group Inc.: A Detailed Examination of EBITDA Performance
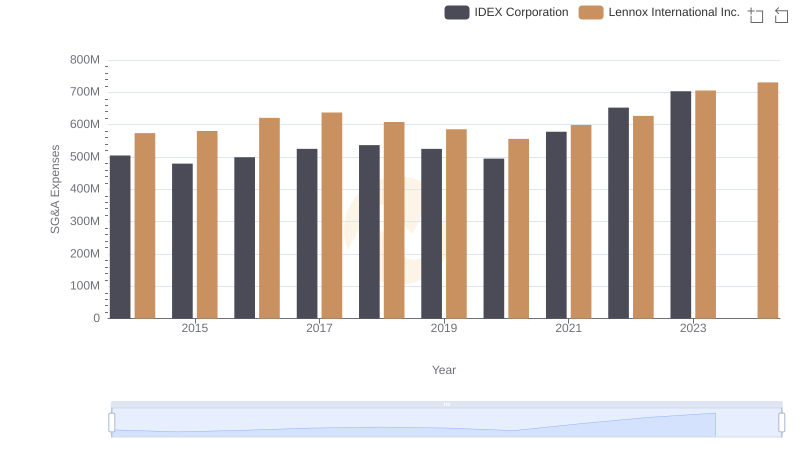
Lennox International Inc. vs IDEX Corporation: SG&A Expense Trends