| __timestamp | Cintas Corporation | Waste Connections, Inc. |
|---|---|---|
| Wednesday, January 1, 2014 | 793811000 | 717805000 |
| Thursday, January 1, 2015 | 877761000 | 191002871 |
| Friday, January 1, 2016 | 933728000 | 900371894 |
| Sunday, January 1, 2017 | 968293000 | 1380632000 |
| Monday, January 1, 2018 | 1227852000 | 1442229014 |
| Tuesday, January 1, 2019 | 1564228000 | 1650754605 |
| Wednesday, January 1, 2020 | 1542737000 | 1597555000 |
| Friday, January 1, 2021 | 1773591000 | 1891001000 |
| Saturday, January 1, 2022 | 1990046000 | 2090554149 |
| Sunday, January 1, 2023 | 2221676000 | 2261354000 |
| Monday, January 1, 2024 | 2523857000 | 2389779000 |
Igniting the spark of knowledge
In the ever-evolving landscape of corporate finance, EBITDA serves as a crucial indicator of a company's operational efficiency. Over the past decade, Cintas Corporation and Waste Connections, Inc. have demonstrated remarkable growth in this metric. Starting in 2014, Cintas reported an EBITDA of approximately $794 million, while Waste Connections trailed slightly at $718 million. Fast forward to 2023, and both companies have more than doubled their EBITDA, with Cintas reaching $2.22 billion and Waste Connections at $2.26 billion. This growth reflects a compound annual growth rate of around 10% for both companies, showcasing their resilience and strategic prowess. Notably, the data for 2024 is incomplete, highlighting the dynamic nature of financial forecasting. As these industry giants continue to expand, their EBITDA trajectories offer valuable insights into their competitive strategies and market positioning.
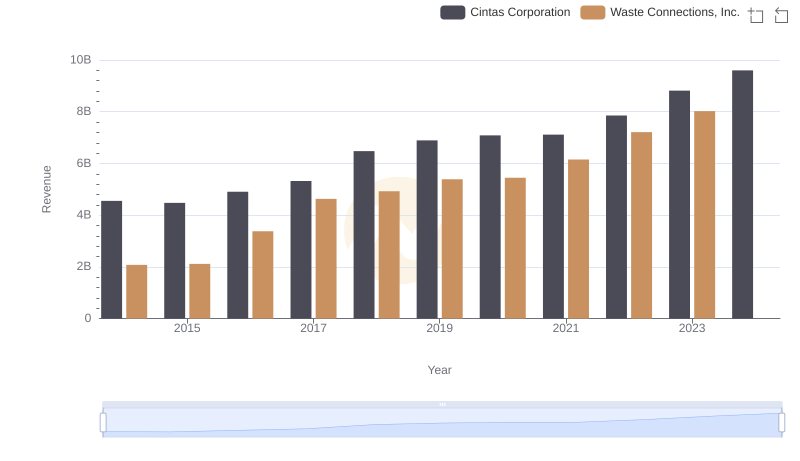
Cintas Corporation and Waste Connections, Inc.: A Comprehensive Revenue Analysis
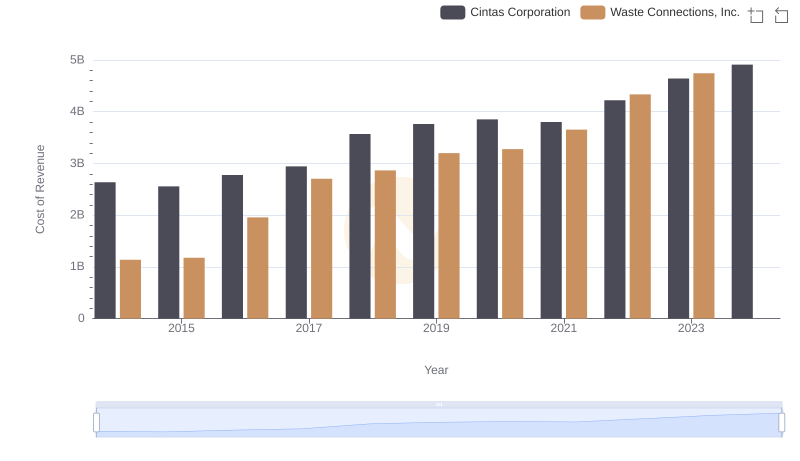
Cost of Revenue Comparison: Cintas Corporation vs Waste Connections, Inc.
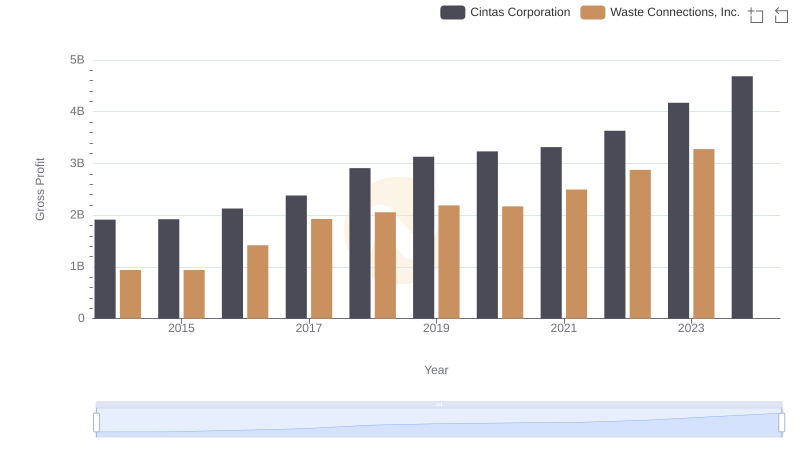
Key Insights on Gross Profit: Cintas Corporation vs Waste Connections, Inc.
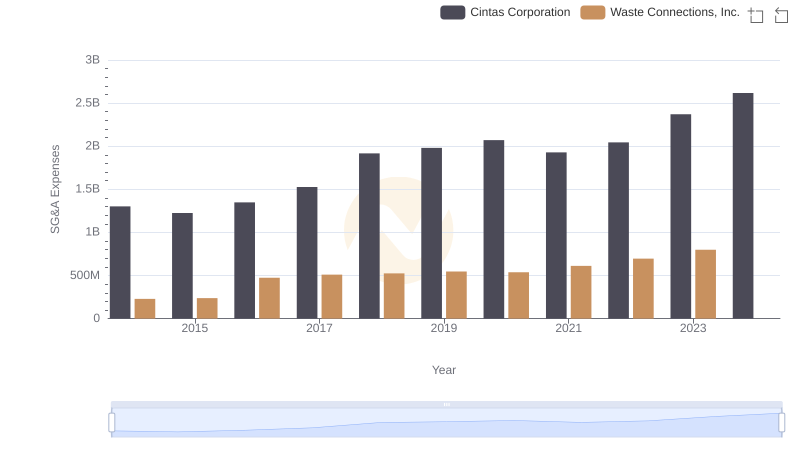
SG&A Efficiency Analysis: Comparing Cintas Corporation and Waste Connections, Inc.
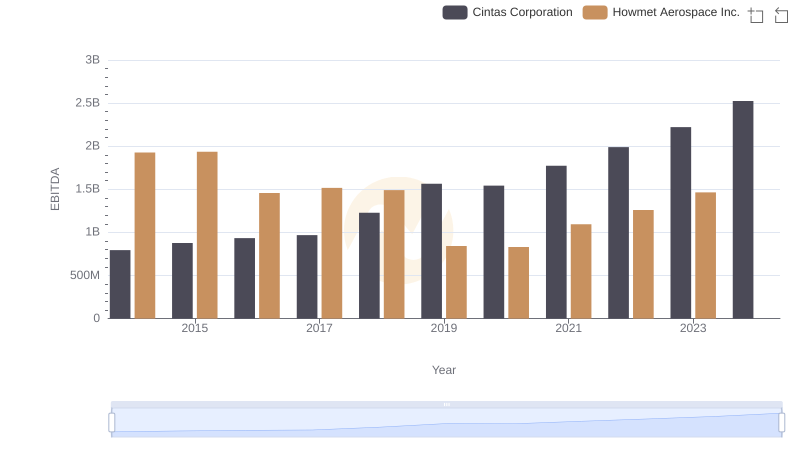
Professional EBITDA Benchmarking: Cintas Corporation vs Howmet Aerospace Inc.
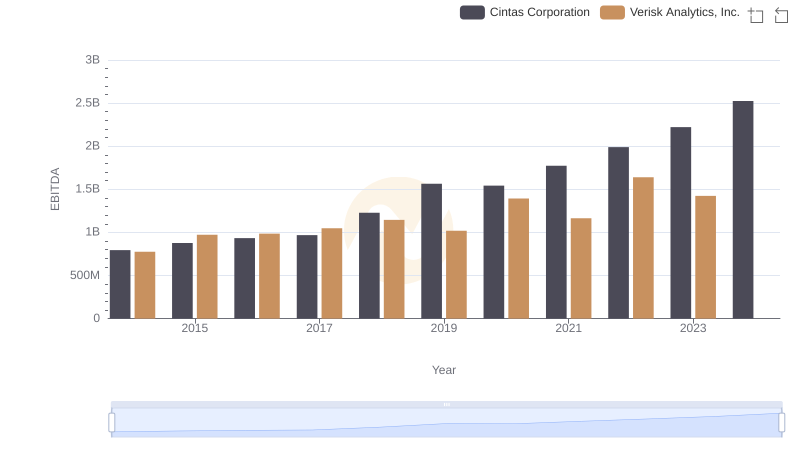
A Side-by-Side Analysis of EBITDA: Cintas Corporation and Verisk Analytics, Inc.
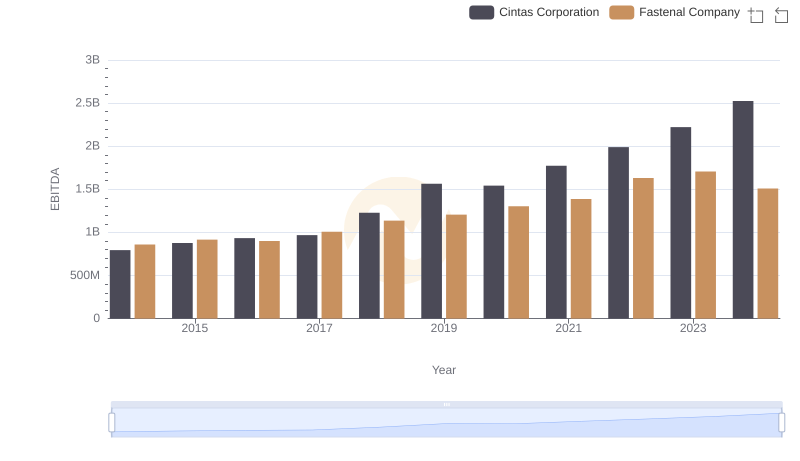
EBITDA Analysis: Evaluating Cintas Corporation Against Fastenal Company
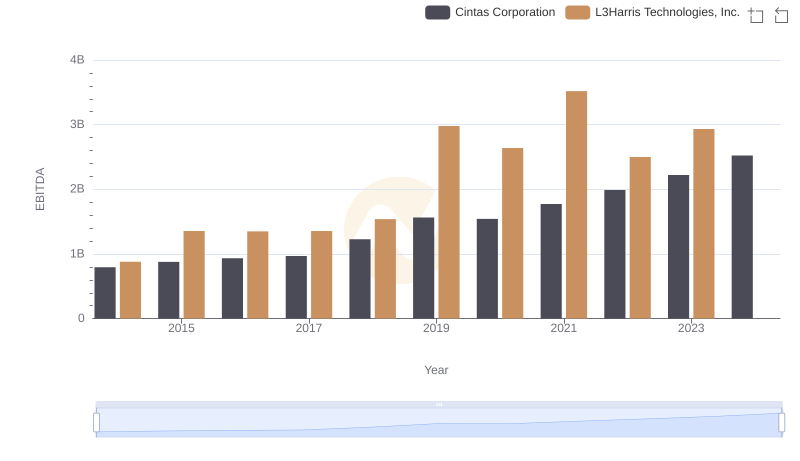
Comprehensive EBITDA Comparison: Cintas Corporation vs L3Harris Technologies, Inc.
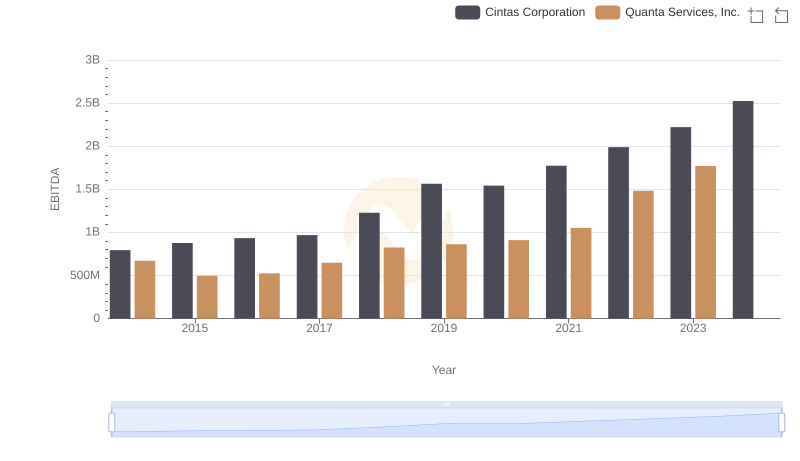
Comparative EBITDA Analysis: Cintas Corporation vs Quanta Services, Inc.
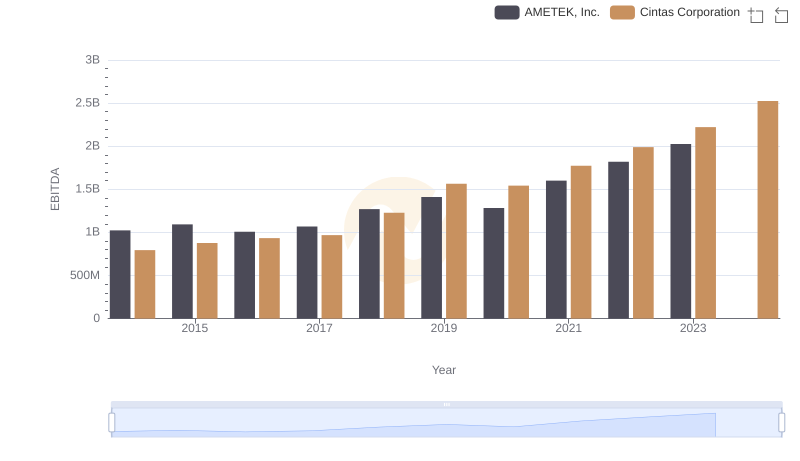
Cintas Corporation vs AMETEK, Inc.: In-Depth EBITDA Performance Comparison
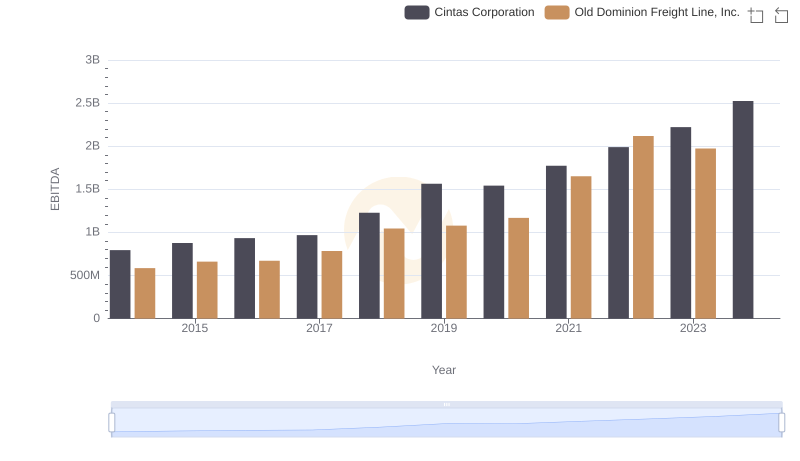
Professional EBITDA Benchmarking: Cintas Corporation vs Old Dominion Freight Line, Inc.
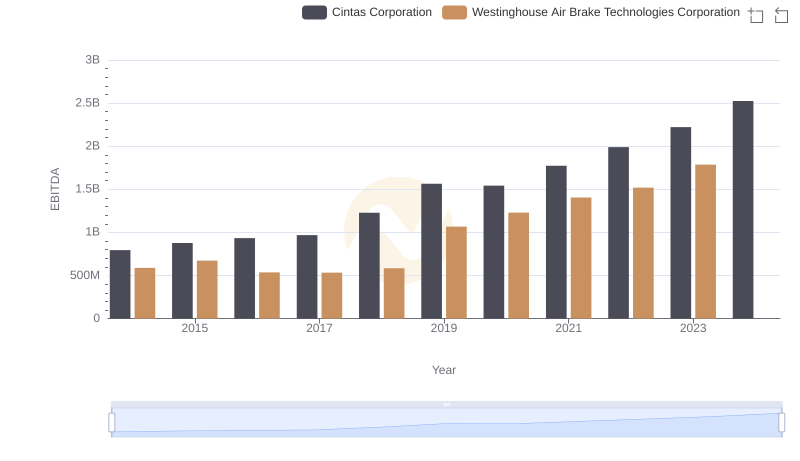
Comprehensive EBITDA Comparison: Cintas Corporation vs Westinghouse Air Brake Technologies Corporation