| __timestamp | Cintas Corporation | Waste Connections, Inc. |
|---|---|---|
| Wednesday, January 1, 2014 | 2637426000 | 1138388000 |
| Thursday, January 1, 2015 | 2555549000 | 1177409000 |
| Friday, January 1, 2016 | 2775588000 | 1957712000 |
| Sunday, January 1, 2017 | 2943086000 | 2704775000 |
| Monday, January 1, 2018 | 3568109000 | 2865704000 |
| Tuesday, January 1, 2019 | 3763715000 | 3198757000 |
| Wednesday, January 1, 2020 | 3851372000 | 3276808000 |
| Friday, January 1, 2021 | 3801689000 | 3654074000 |
| Saturday, January 1, 2022 | 4222213000 | 4336012000 |
| Sunday, January 1, 2023 | 4642401000 | 4744513000 |
| Monday, January 1, 2024 | 4910199000 | 5191706000 |
Igniting the spark of knowledge
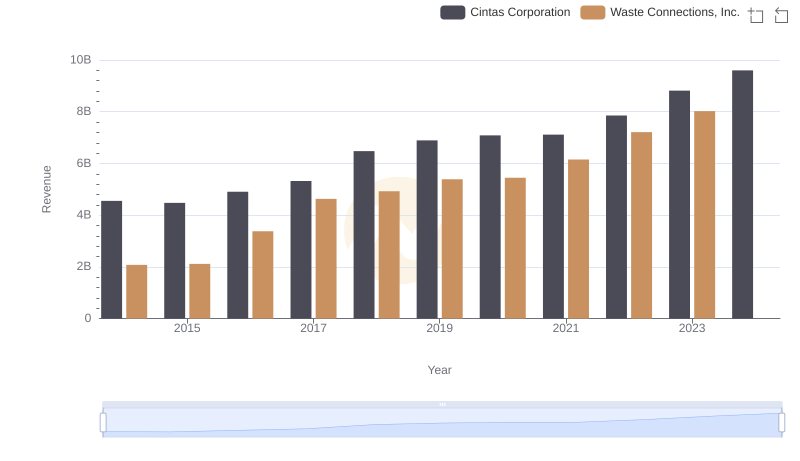
In the competitive landscape of corporate America, Cintas Corporation and Waste Connections, Inc. have emerged as formidable players. Over the past decade, from 2014 to 2023, these companies have shown remarkable growth in their cost of revenue, a key indicator of their operational scale and efficiency.
Cintas Corporation, a leader in uniform rental and facility services, has seen its cost of revenue grow by approximately 86%, from $2.64 billion in 2014 to $4.64 billion in 2023. This steady increase reflects its expanding market presence and operational efficiency.
Meanwhile, Waste Connections, Inc., a prominent waste management company, has experienced a staggering 317% increase in cost of revenue, from $1.14 billion in 2014 to $4.74 billion in 2023. This growth underscores its strategic acquisitions and robust service expansion.
Interestingly, data for 2024 is incomplete, leaving room for speculation on future trends.
Cintas Corporation and Waste Connections, Inc.: A Comprehensive Revenue Analysis
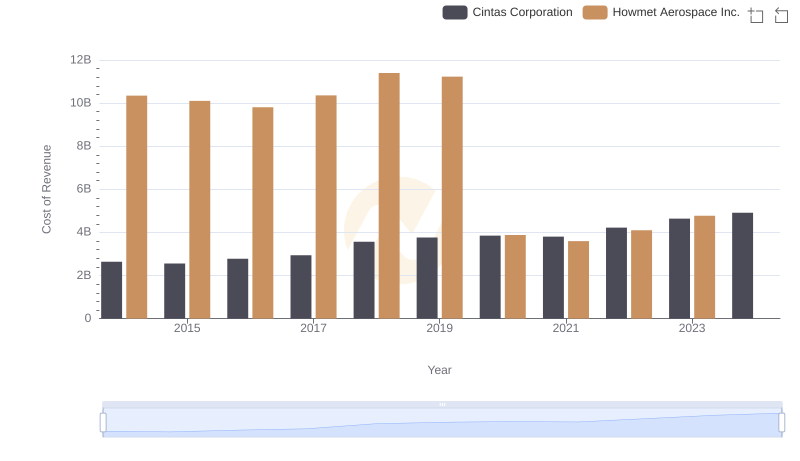
Cost of Revenue Comparison: Cintas Corporation vs Howmet Aerospace Inc.
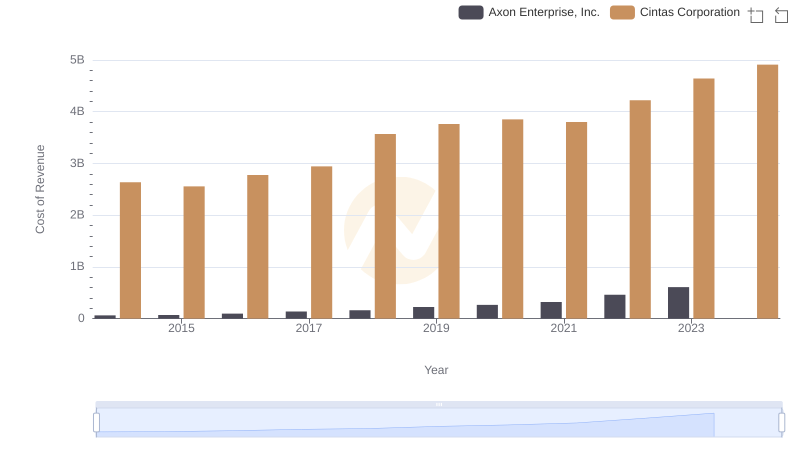
Cost of Revenue: Key Insights for Cintas Corporation and Axon Enterprise, Inc.
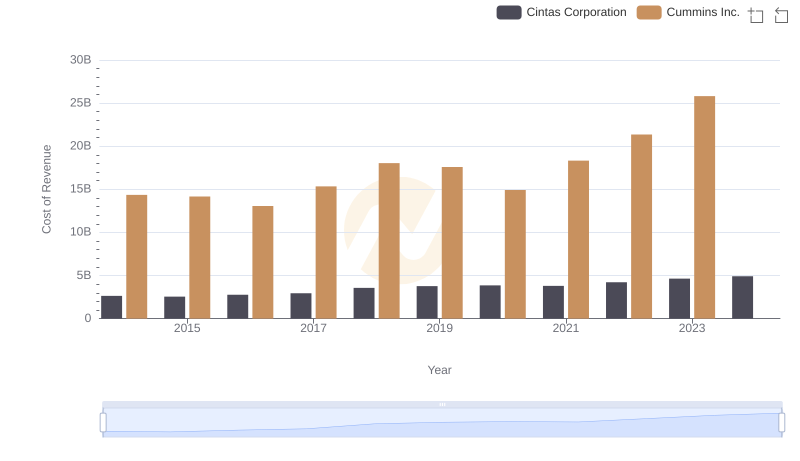
Cost Insights: Breaking Down Cintas Corporation and Cummins Inc.'s Expenses
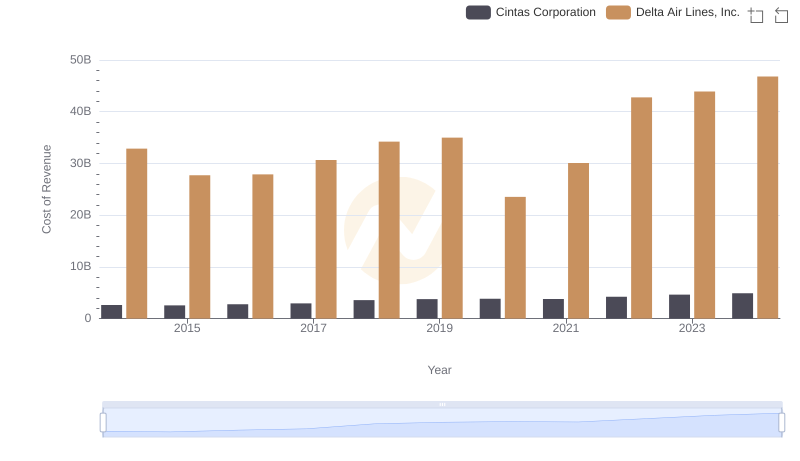
Cost Insights: Breaking Down Cintas Corporation and Delta Air Lines, Inc.'s Expenses
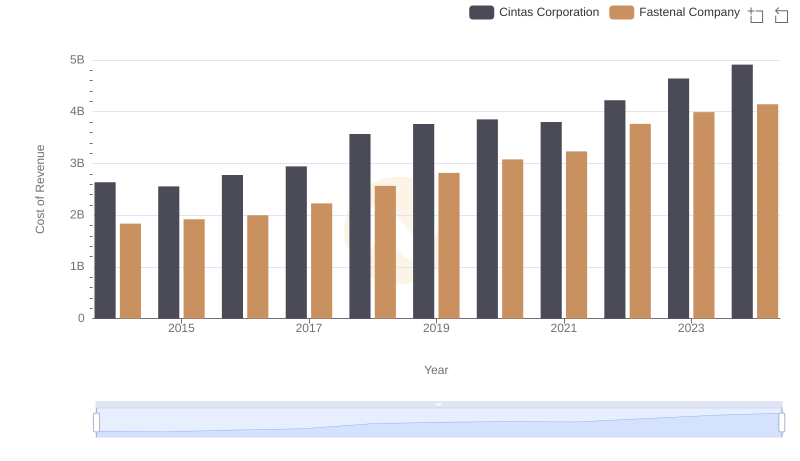
Cost of Revenue Trends: Cintas Corporation vs Fastenal Company
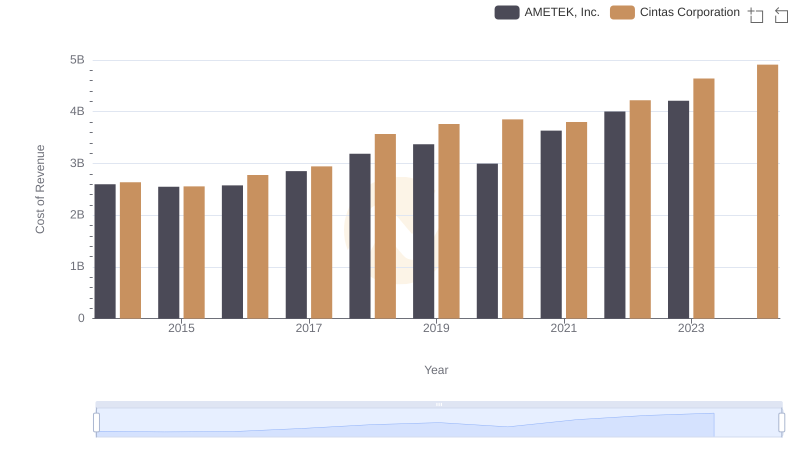
Analyzing Cost of Revenue: Cintas Corporation and AMETEK, Inc.
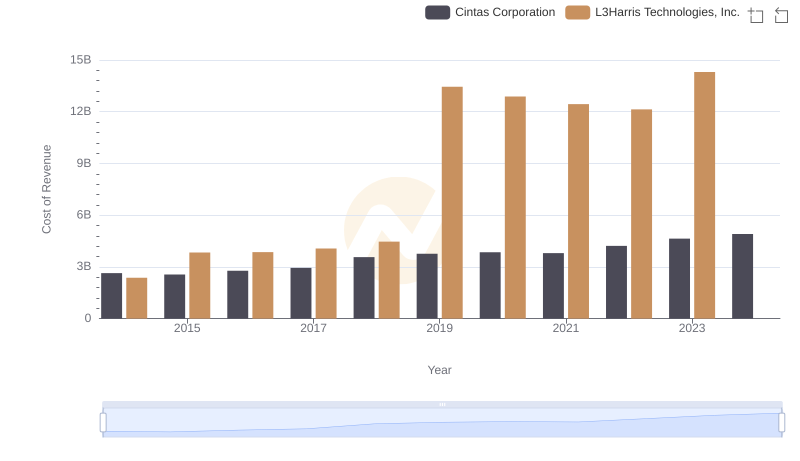
Analyzing Cost of Revenue: Cintas Corporation and L3Harris Technologies, Inc.
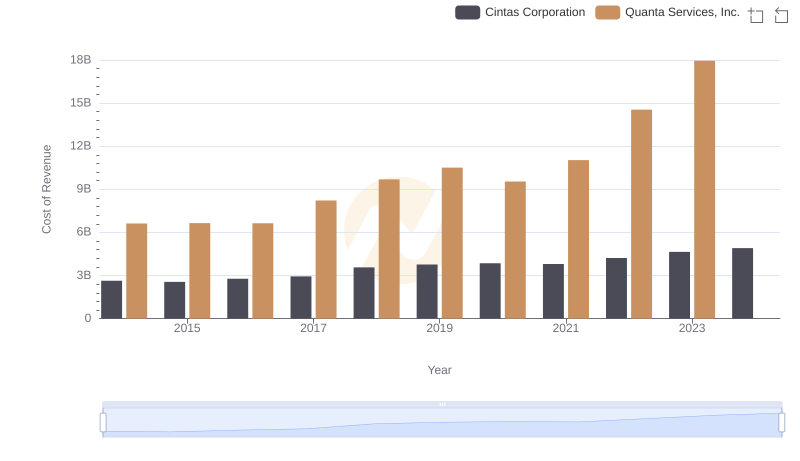
Analyzing Cost of Revenue: Cintas Corporation and Quanta Services, Inc.
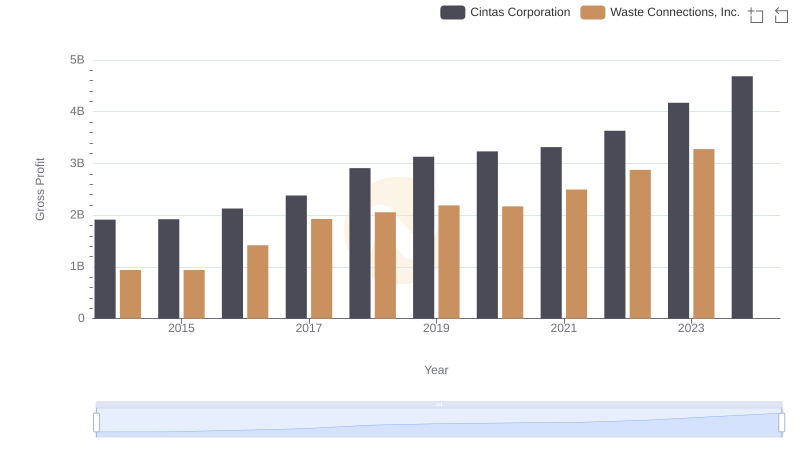
Key Insights on Gross Profit: Cintas Corporation vs Waste Connections, Inc.
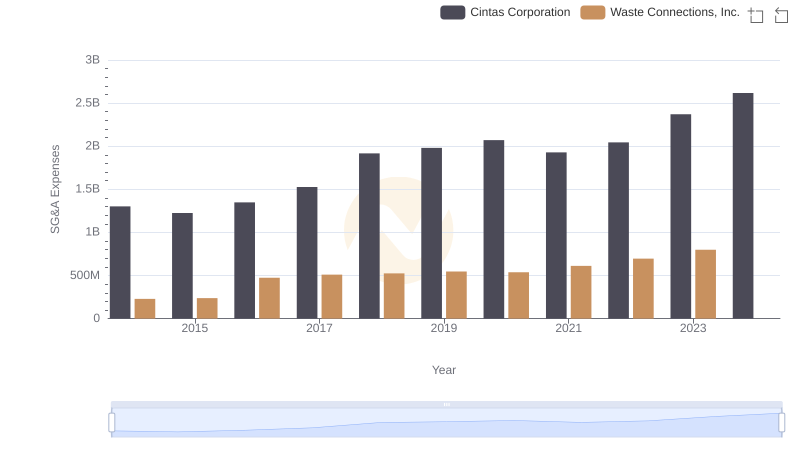
SG&A Efficiency Analysis: Comparing Cintas Corporation and Waste Connections, Inc.
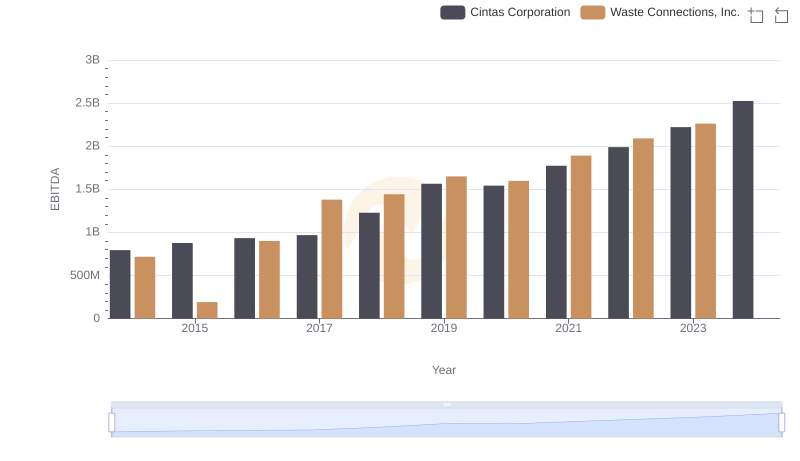
A Side-by-Side Analysis of EBITDA: Cintas Corporation and Waste Connections, Inc.