| __timestamp | American Airlines Group Inc. | Parker-Hannifin Corporation |
|---|---|---|
| Wednesday, January 1, 2014 | 1544000000 | 1633992000 |
| Thursday, January 1, 2015 | 1394000000 | 1544746000 |
| Friday, January 1, 2016 | 1323000000 | 1359360000 |
| Sunday, January 1, 2017 | 1477000000 | 1453935000 |
| Monday, January 1, 2018 | 1520000000 | 1657152000 |
| Tuesday, January 1, 2019 | 1602000000 | 1543939000 |
| Wednesday, January 1, 2020 | 513000000 | 1656553000 |
| Friday, January 1, 2021 | 1098000000 | 1527302000 |
| Saturday, January 1, 2022 | 1815000000 | 1627116000 |
| Sunday, January 1, 2023 | 1799000000 | 3354103000 |
| Monday, January 1, 2024 | 3315177000 |
Unleashing the power of data
In the ever-evolving landscape of corporate finance, Selling, General, and Administrative (SG&A) expenses serve as a critical indicator of a company's operational efficiency. From 2014 to 2023, Parker-Hannifin Corporation and American Airlines Group Inc. have showcased contrasting trends in their SG&A expenditures. Parker-Hannifin, a leader in motion and control technologies, saw a remarkable 105% increase in SG&A costs, peaking in 2023. This surge reflects strategic investments in innovation and expansion. Meanwhile, American Airlines, a titan in the aviation industry, experienced a more volatile trajectory. After a significant dip in 2020, likely due to the pandemic, their SG&A expenses rebounded by 250% by 2022. However, 2023 data remains incomplete, leaving room for speculation. These trends underscore the dynamic nature of SG&A expenses and their role in shaping corporate strategies across industries.
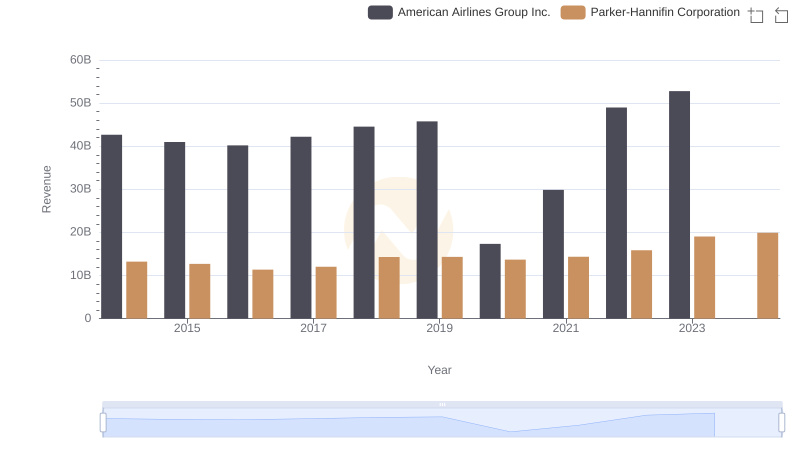
Revenue Insights: Parker-Hannifin Corporation and American Airlines Group Inc. Performance Compared
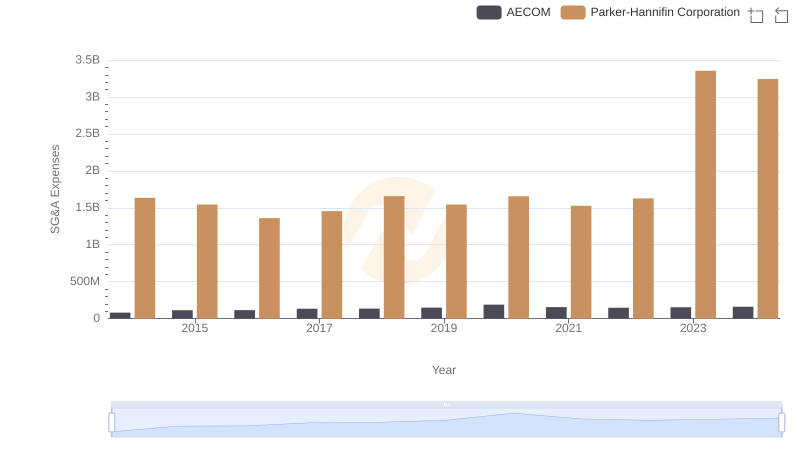
SG&A Efficiency Analysis: Comparing Parker-Hannifin Corporation and AECOM
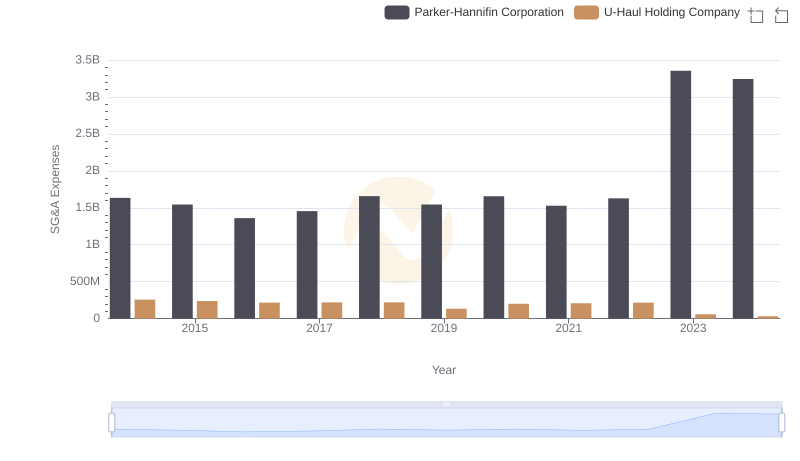
Operational Costs Compared: SG&A Analysis of Parker-Hannifin Corporation and U-Haul Holding Company
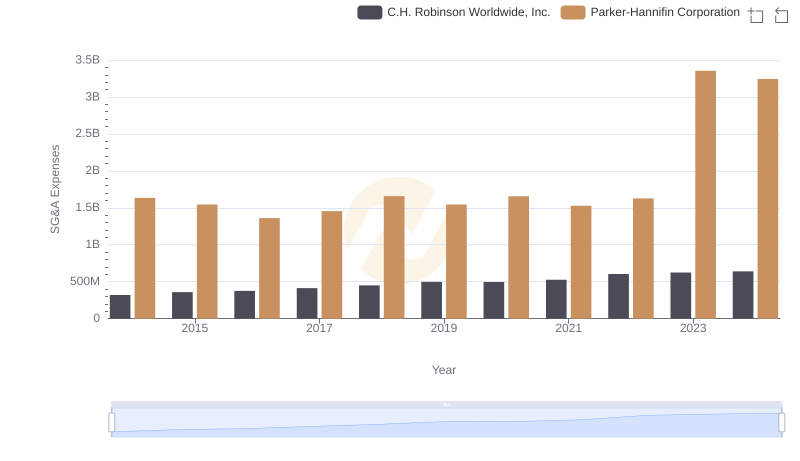
Parker-Hannifin Corporation and C.H. Robinson Worldwide, Inc.: SG&A Spending Patterns Compared
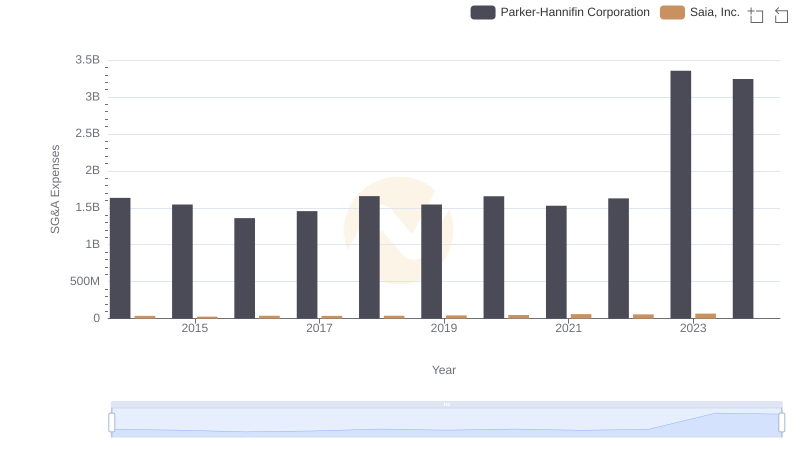
Parker-Hannifin Corporation and Saia, Inc.: SG&A Spending Patterns Compared
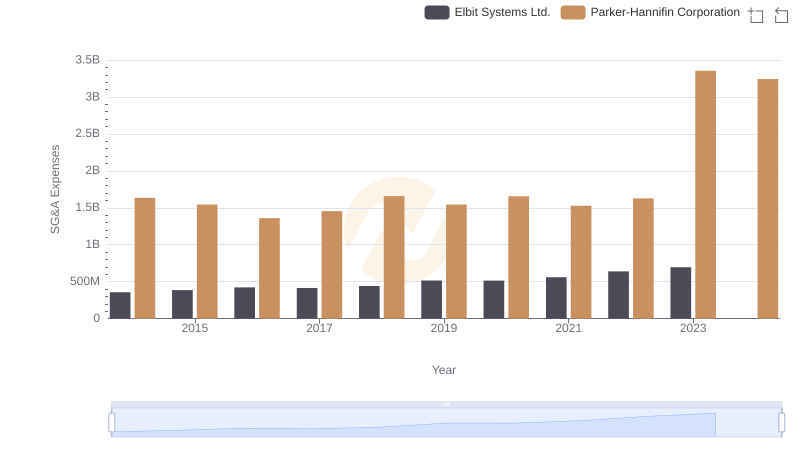
SG&A Efficiency Analysis: Comparing Parker-Hannifin Corporation and Elbit Systems Ltd.
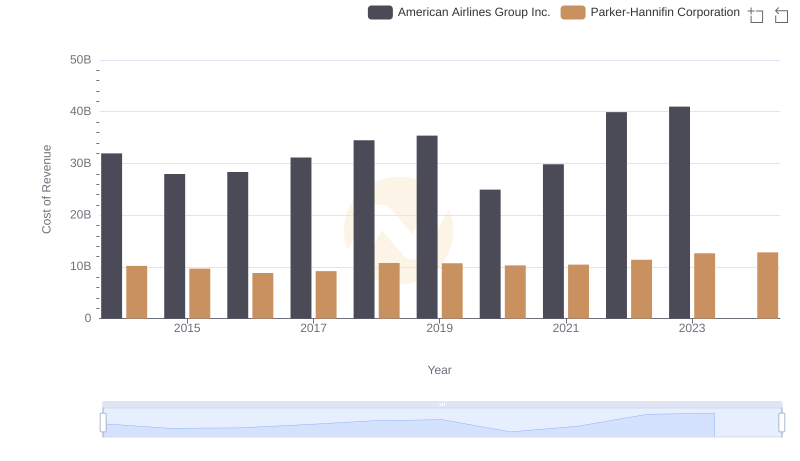
Analyzing Cost of Revenue: Parker-Hannifin Corporation and American Airlines Group Inc.
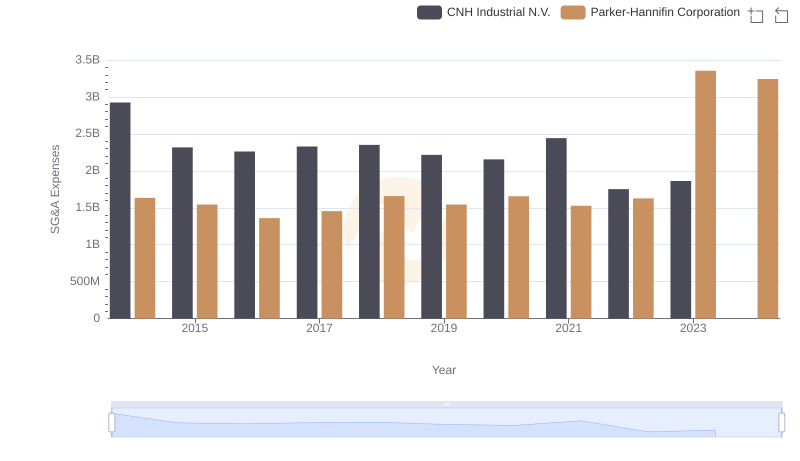
Who Optimizes SG&A Costs Better? Parker-Hannifin Corporation or CNH Industrial N.V.
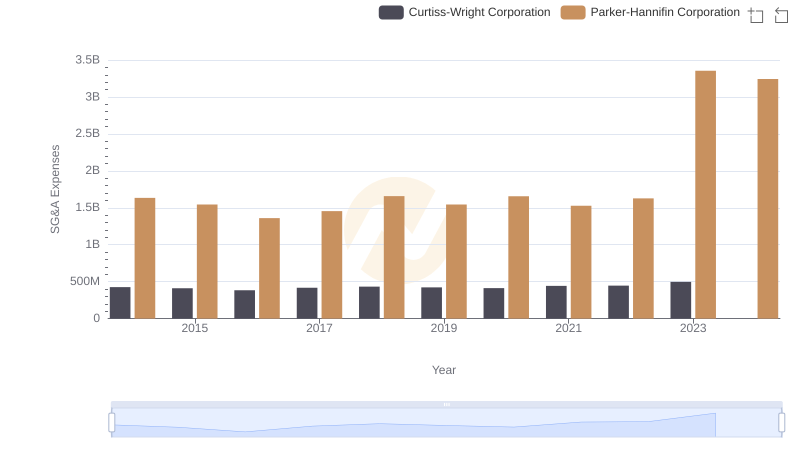
Operational Costs Compared: SG&A Analysis of Parker-Hannifin Corporation and Curtiss-Wright Corporation
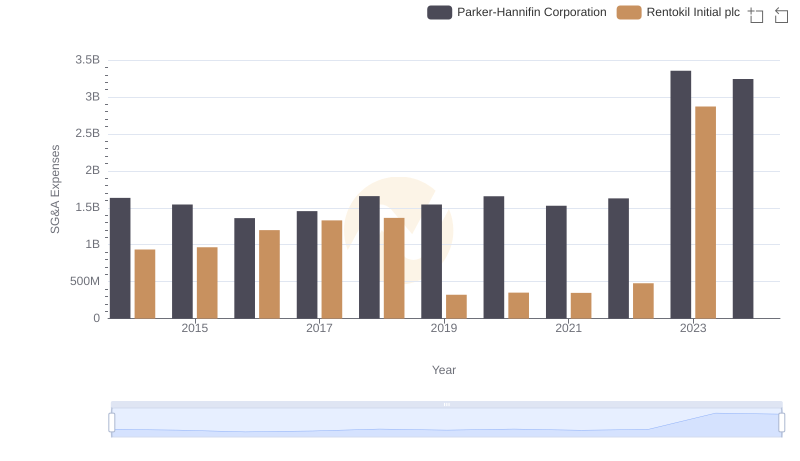
Who Optimizes SG&A Costs Better? Parker-Hannifin Corporation or Rentokil Initial plc
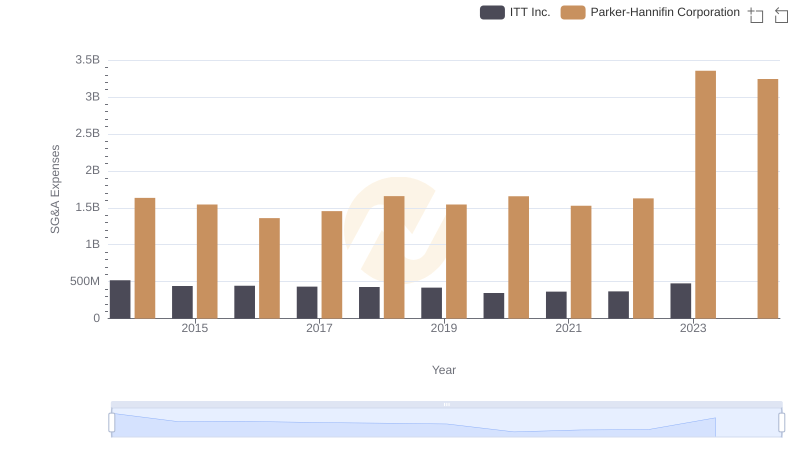
Parker-Hannifin Corporation or ITT Inc.: Who Manages SG&A Costs Better?