| __timestamp | C.H. Robinson Worldwide, Inc. | Parker-Hannifin Corporation |
|---|---|---|
| Wednesday, January 1, 2014 | 320213000 | 1633992000 |
| Thursday, January 1, 2015 | 358760000 | 1544746000 |
| Friday, January 1, 2016 | 375061000 | 1359360000 |
| Sunday, January 1, 2017 | 413404000 | 1453935000 |
| Monday, January 1, 2018 | 449610000 | 1657152000 |
| Tuesday, January 1, 2019 | 497806000 | 1543939000 |
| Wednesday, January 1, 2020 | 496122000 | 1656553000 |
| Friday, January 1, 2021 | 526371000 | 1527302000 |
| Saturday, January 1, 2022 | 603415000 | 1627116000 |
| Sunday, January 1, 2023 | 624266000 | 3354103000 |
| Monday, January 1, 2024 | 639624000 | 3315177000 |
Igniting the spark of knowledge
In the world of industrial and logistics giants, Parker-Hannifin Corporation and C.H. Robinson Worldwide, Inc. have showcased distinct trends in their Selling, General, and Administrative (SG&A) expenses over the past decade. From 2014 to 2024, Parker-Hannifin's SG&A expenses have surged by over 98%, peaking in 2023 with a remarkable 3.35 billion dollars. This reflects their aggressive expansion and strategic investments in innovation and technology.
Conversely, C.H. Robinson Worldwide, Inc. has demonstrated a steady increase in SG&A expenses, growing by approximately 100% over the same period. Their consistent rise, reaching 639 million dollars in 2024, underscores their commitment to enhancing operational efficiency and customer service.
These contrasting spending patterns highlight the diverse strategies employed by these industry leaders to navigate the ever-evolving market landscape, offering valuable insights into their corporate priorities and future trajectories.
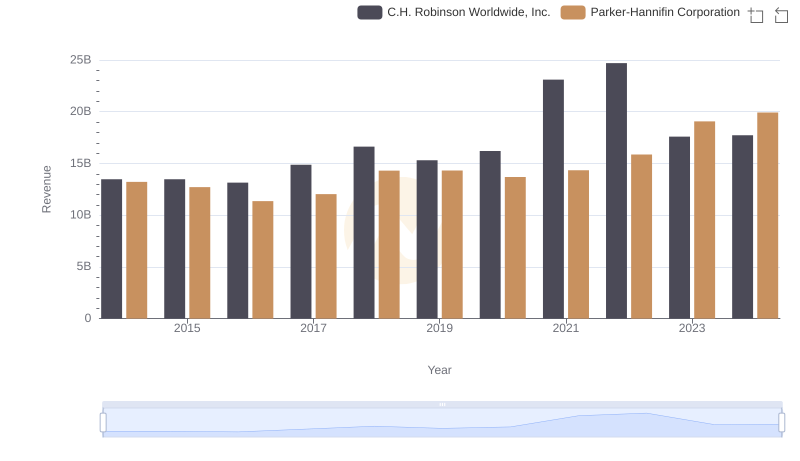
Revenue Insights: Parker-Hannifin Corporation and C.H. Robinson Worldwide, Inc. Performance Compared
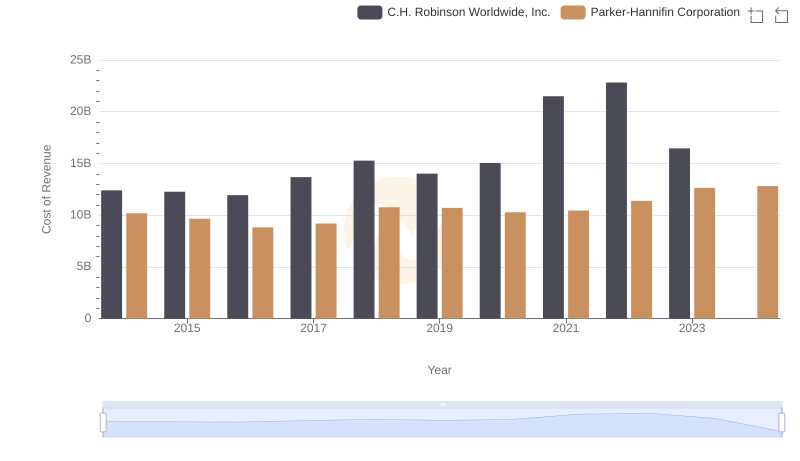
Cost of Revenue Trends: Parker-Hannifin Corporation vs C.H. Robinson Worldwide, Inc.
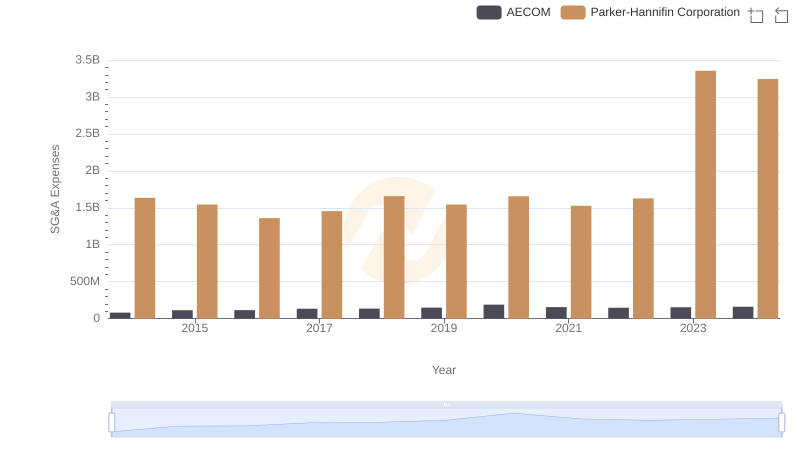
SG&A Efficiency Analysis: Comparing Parker-Hannifin Corporation and AECOM
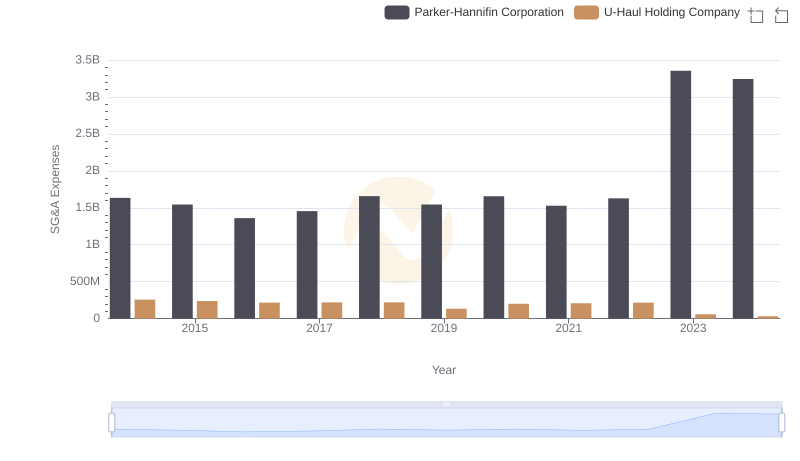
Operational Costs Compared: SG&A Analysis of Parker-Hannifin Corporation and U-Haul Holding Company
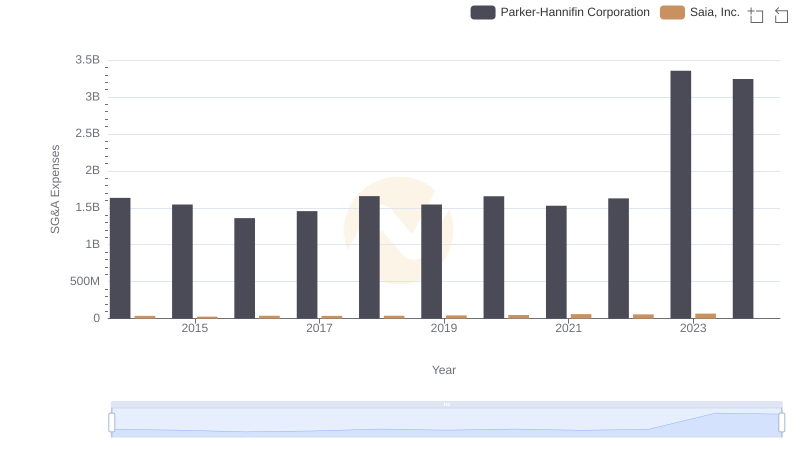
Parker-Hannifin Corporation and Saia, Inc.: SG&A Spending Patterns Compared
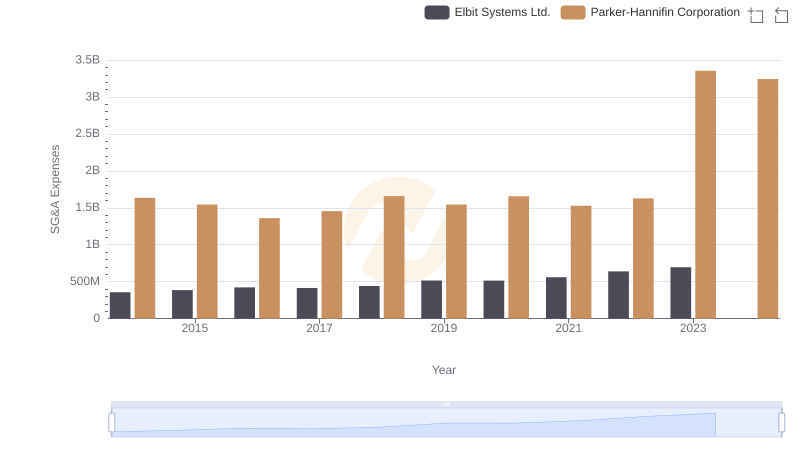
SG&A Efficiency Analysis: Comparing Parker-Hannifin Corporation and Elbit Systems Ltd.
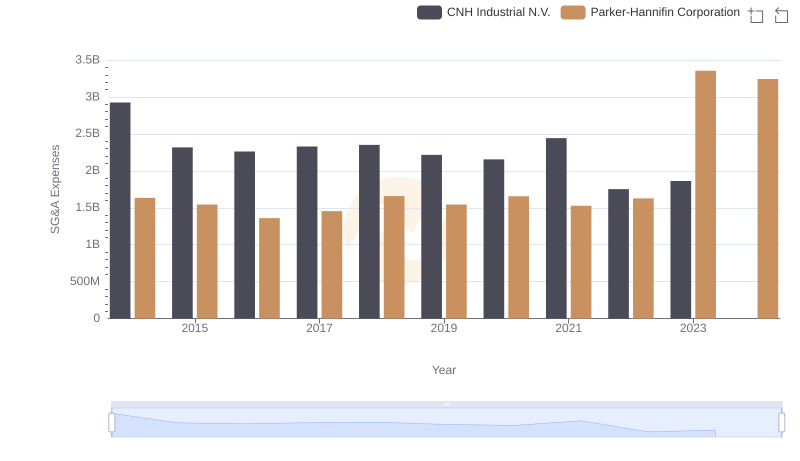
Who Optimizes SG&A Costs Better? Parker-Hannifin Corporation or CNH Industrial N.V.
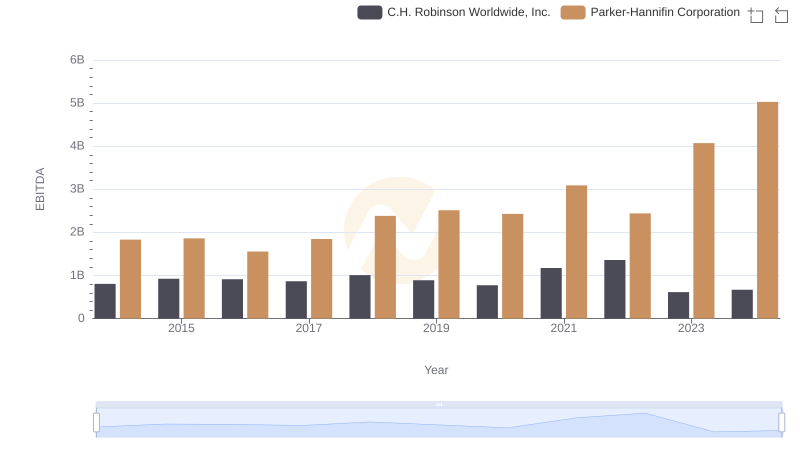
A Side-by-Side Analysis of EBITDA: Parker-Hannifin Corporation and C.H. Robinson Worldwide, Inc.

Selling, General, and Administrative Costs: Parker-Hannifin Corporation vs American Airlines Group Inc.